
While advocates call for the Federal Reserve to lower its policy rate, few seem to grasp what this would actually mean. This analysis examines why “End the Fed” calls are misguided and what really drives mortgage rates.
The Real Estate Blame Game
The “End the Fed” slogan stems from pain in various industries, particularly residential and commercial real estate. These sectors are hurting for multiple reasons, yet they’ve identified a common enemy: the Federal Reserve’s Board of Governors.
Rather than acknowledging falling occupancy rates, stagnant real wage growth, or unrealistic asking prices, critics point to the Fed’s policy rate. The argument is simple: if the Fed would just cut rates more aggressively, mortgage rates would fall and business would boom.
But the data tells a different story.
What Really Drives Mortgage Rates?
The central flaw in the “End the Fed” argument is the assumption that the Fed, rather than the market, controls mortgage rates. This is simply incorrect.
The 30-year mortgage rate is primarily driven by the 10-year Treasury yield plus a spread, or risk premium. This spread has fluctuated significantly over time, ranging between roughly 53 and 485 basis points.
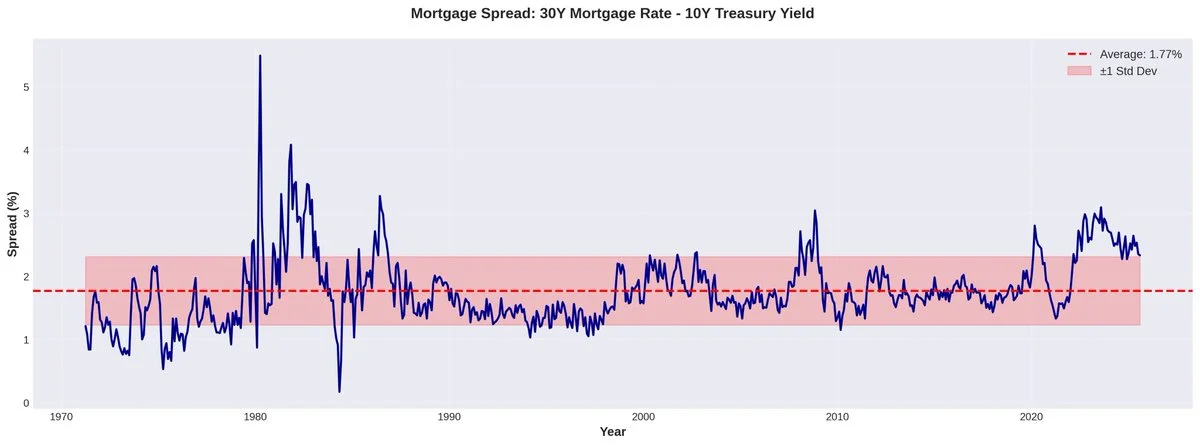
Multiple factors influence where this spread trades in the market: credit risk, prepayment risk, servicing costs, market liquidity, and regulatory expenses. The Fed has no direct control over any of these factors.
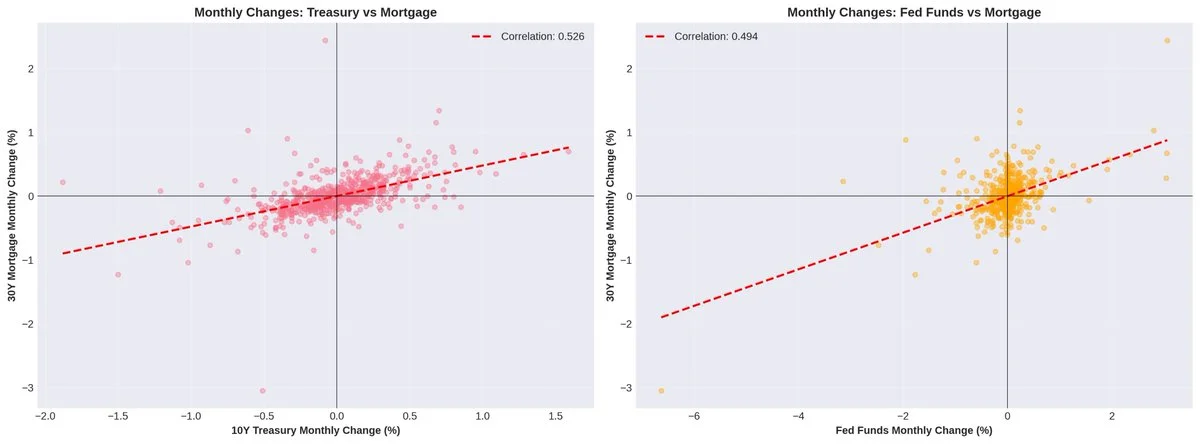
Short-Term Rates vs. Long-Term Rates
The Fed sets short-term rates. Markets determine long-term rates.
The federal funds rate is the overnight lending rate between banks, influencing liquidity conditions and certain types of commercial lending. Mortgage rates, however, are driven by expectations about future inflation, economic growth, capital flows, credit risk, and government deficits and debt levels.
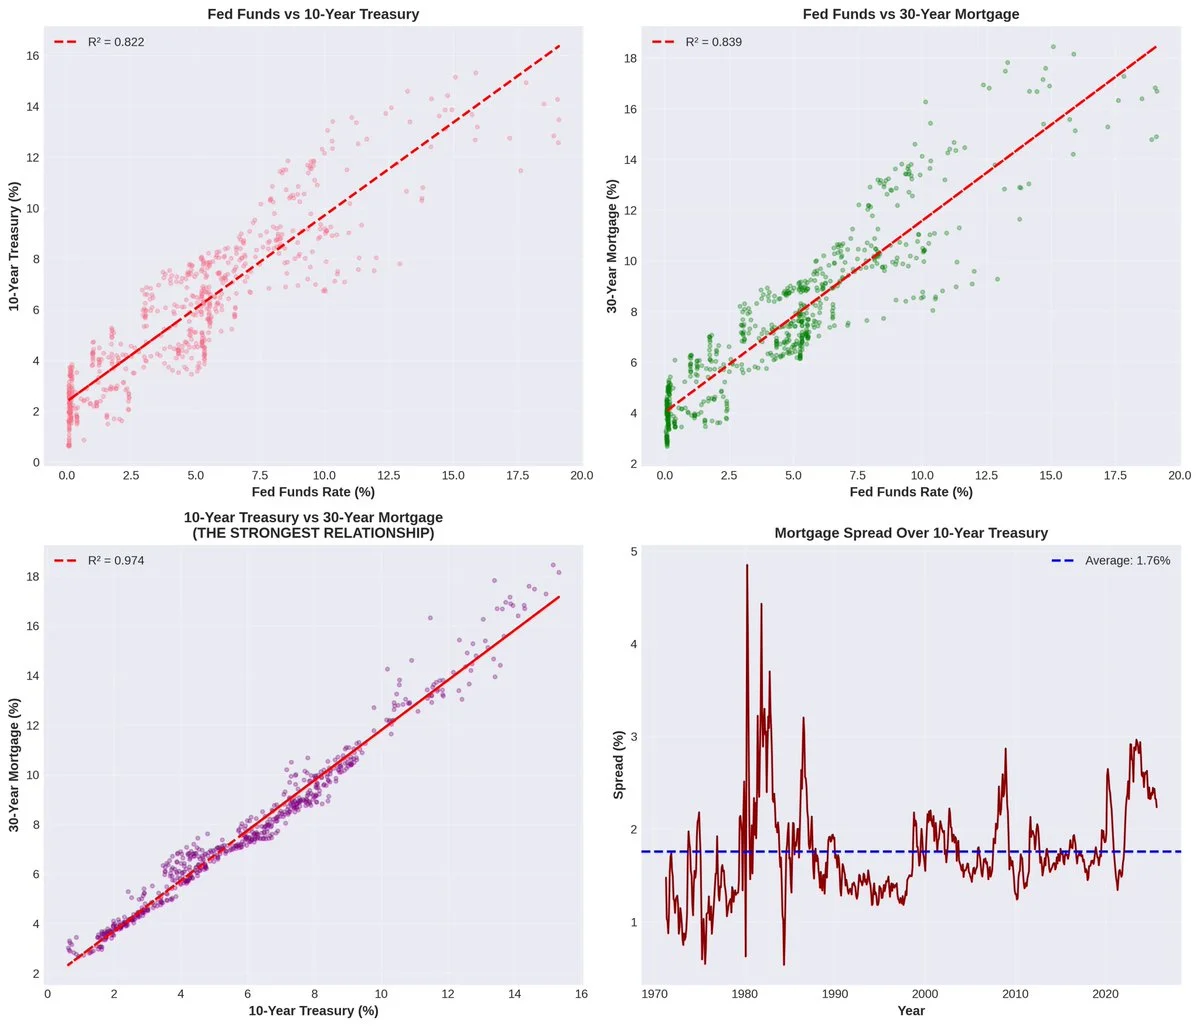
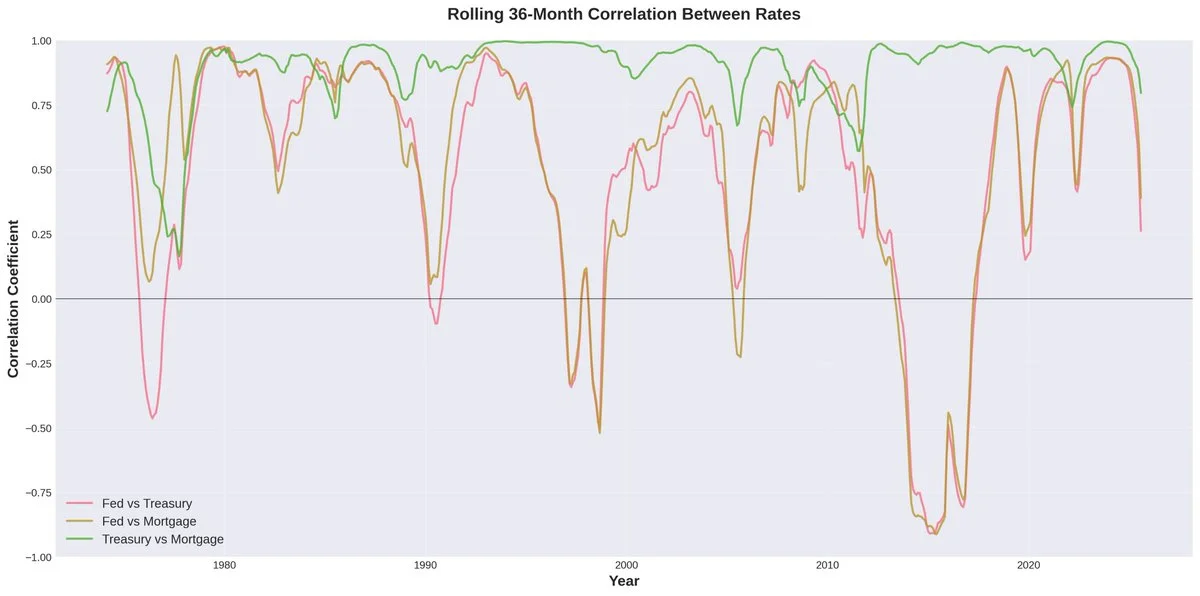
The numbers are revealing. Over rolling 36-month periods, the correlation between the federal funds rate and mortgage rates averages just 0.53, while the correlation between Treasury yields and mortgage rates averages 0.89. This means markets—via the 10-year Treasury rate—have roughly 70% more influence on mortgage rates than the Fed does.
The Lead-Lag Analysis
A lead-lag analysis reveals that variation across all time lags is relatively low, with correlation rising the further from zero months we move. This pattern demonstrates that all three rates move together with long-term economic trends, rather than one leading the others.
They’re all responding to the same slow-moving fundamental forces: inflation regimes, economic growth cycles, demographic shifts, and global capital flows.
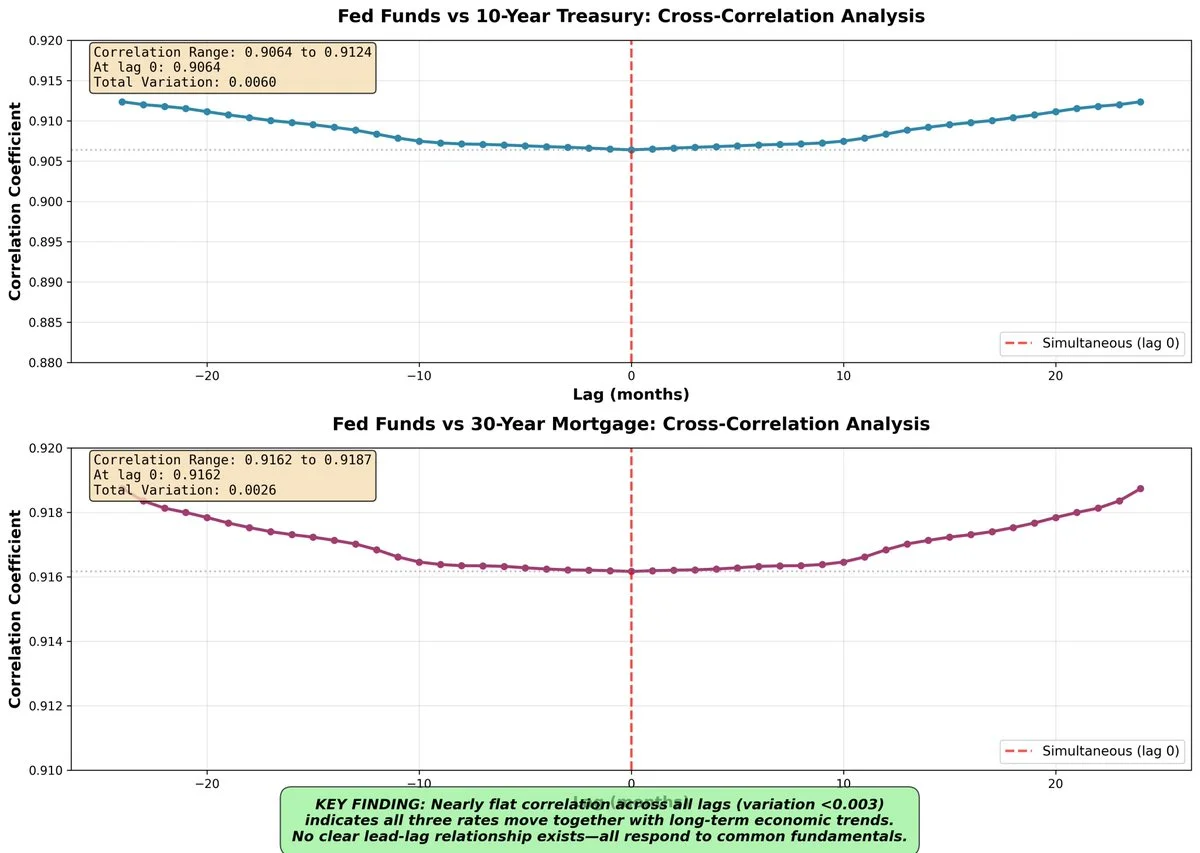
If the Fed were truly in control, we would see a clear pattern where changes in the federal funds rate precede and predict changes in mortgage rates, with peak correlation occurring at a positive lag. Instead, the flat cross-correlation function reveals that the Fed doesn’t lead these rates—it moves with them.
This explains why the Fed’s attempts to control long-term rates through policy often fall short.
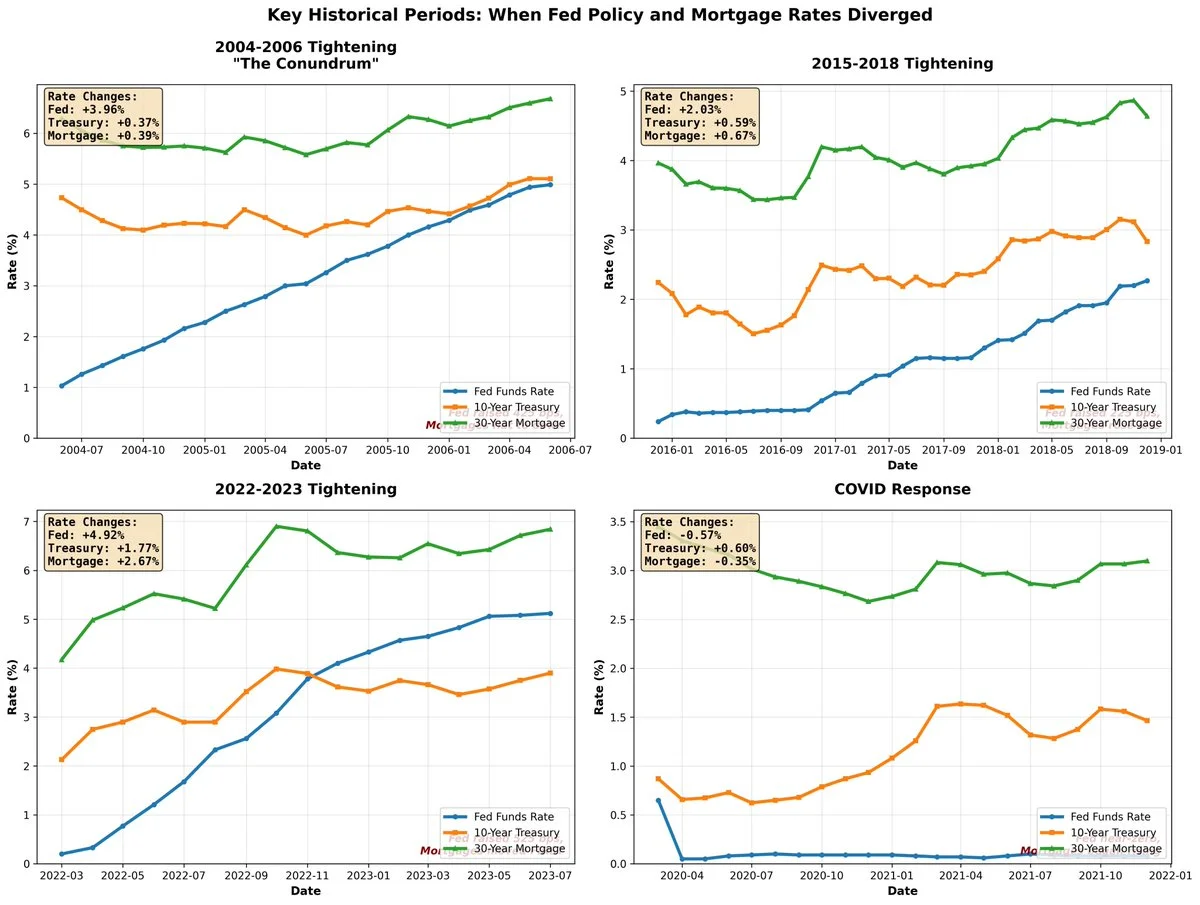
Historical Divergences Tell the Story
During the 2004-2006 tightening cycle, the Fed raised rates by 425 basis points, yet long-term rates barely budged because the underlying economic fundamentals didn’t support higher long-term rates. The federal funds rate increased from 100 bps to 525 bps, while the 10-year Treasury rate barely moved between 400 and 500 bps. Most importantly, the 30-year mortgage rate actually declined during parts of this hiking cycle.
The Fed is a participant, not a director.
When Short and Long Rates Diverge
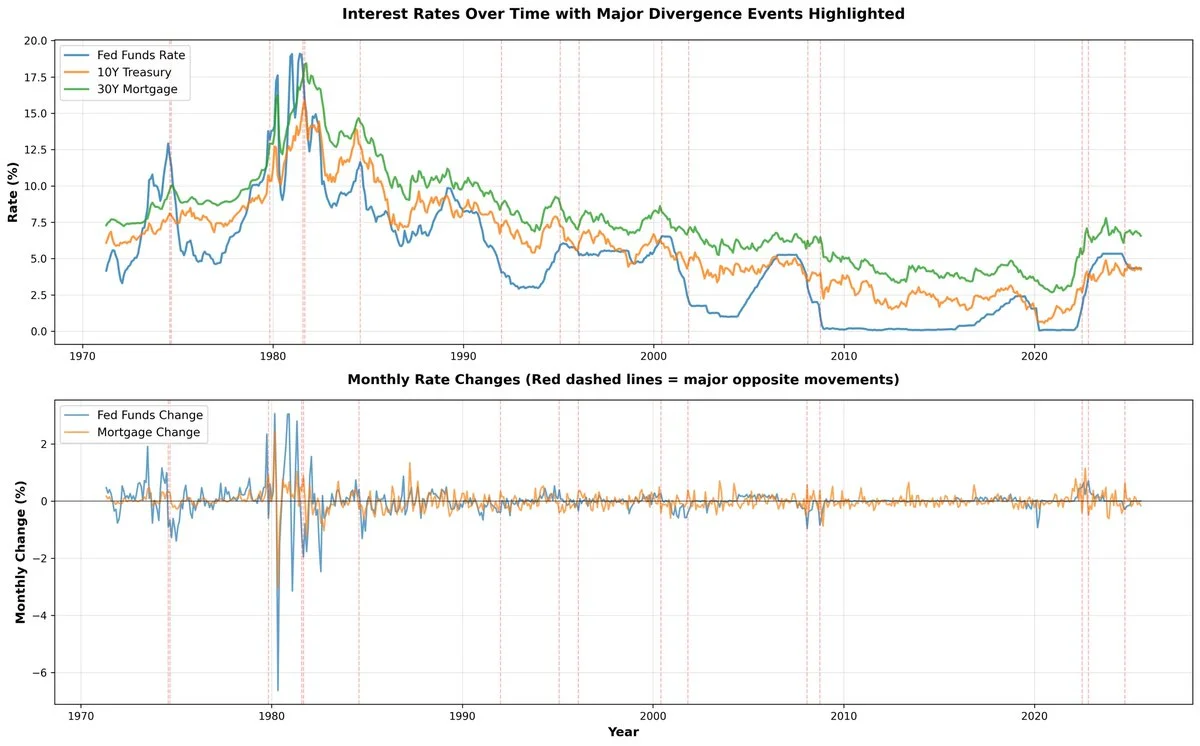
While these rates show strong correlation over extended periods, shorter time frames reveal a different picture. Our analysis identified 57 months where the federal funds rate moved significantly in one direction while mortgage rates moved significantly in the opposite direction.
Key historical examples of divergence include:
1974–1975: The Fed cut rates aggressively during the recession, yet mortgage rates continued to rise due to inflation concerns.
1981–1982: The Fed maintained high rates to fight inflation, but mortgage rates began to fall as inflation expectations improved.
2006–2007: The Fed paused or cut rates, but mortgage rates remained elevated due to credit risk concerns preceding the financial crisis.
The Recent Tightening Cycle
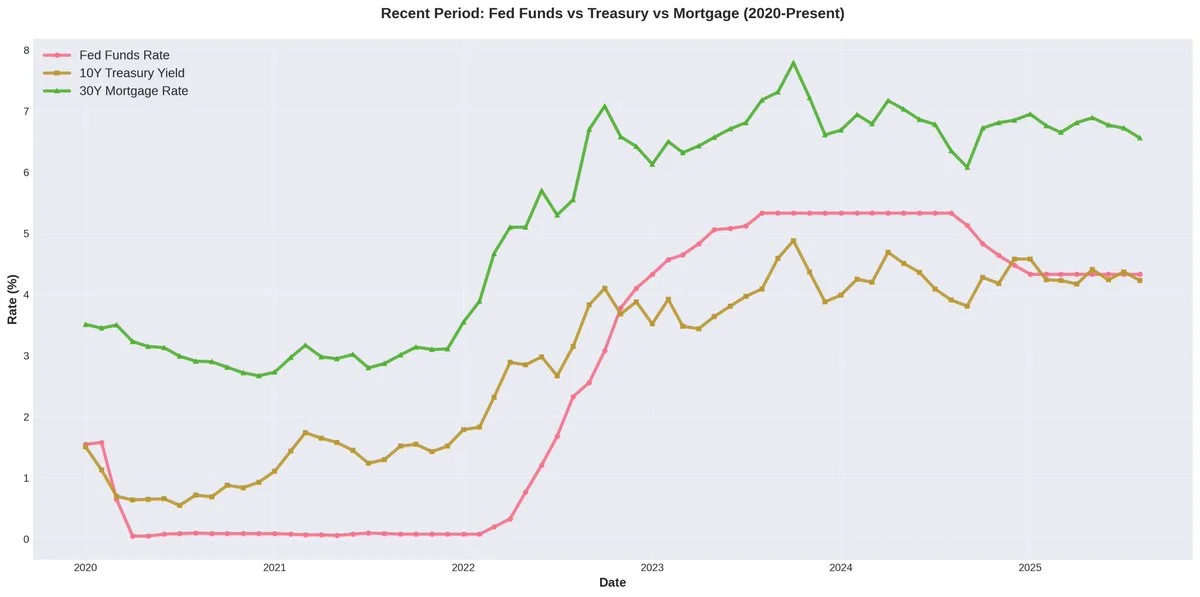
During the most recent tightening cycle, the Fed raised rates from 0 bps to 525 bps. While mortgage rates followed this rise from 3% to 7%, the move was primarily driven by inflation expectations and widening MBS spreads. In fact, mortgage rates began increasing before the Fed even started raising rates.
Over the 2024–2025 period, we’ve seen 75 bps in rate cuts, while the 10-year Treasury and 30-year mortgage rates have remained relatively unchanged. This reflects inflation uncertainty and the fear that cutting too aggressively could fuel inflation further.
The Bottom Line
Calls for the Fed to cut rates in hopes of lowering mortgage rates and long-term financing costs are misguided at best. The Fed is simply another participant in the market, attempting to predict the future just like everyone else. They are no better or worse than anyone else at this task.
If they were, the long end of the yield curve would be telling a very different story.
The market, not the Fed, drives long-term rates. Understanding this distinction is crucial for anyone trying to navigate the current economic environment or make informed decisions about real estate and financing.