
Housing, for many Americans, is simply unaffordable. This isn’t a new concept, but we decided to take a deeper look into the U.S. housing market to show just how severe the affordability crisis has become.
The Deteriorating Numbers
A report from the National Association of Realtors and Realtor.com examined housing affordability, and the findings highlight how much the landscape has changed over the past few years.
Specifically, for households earning between $75,000 and $100,000 annually, only 21.2% of listings were within reach as of March 2025. In comparison, that figure stood at 48.8% in March 2019—illustrating just how much affordability has deteriorated.
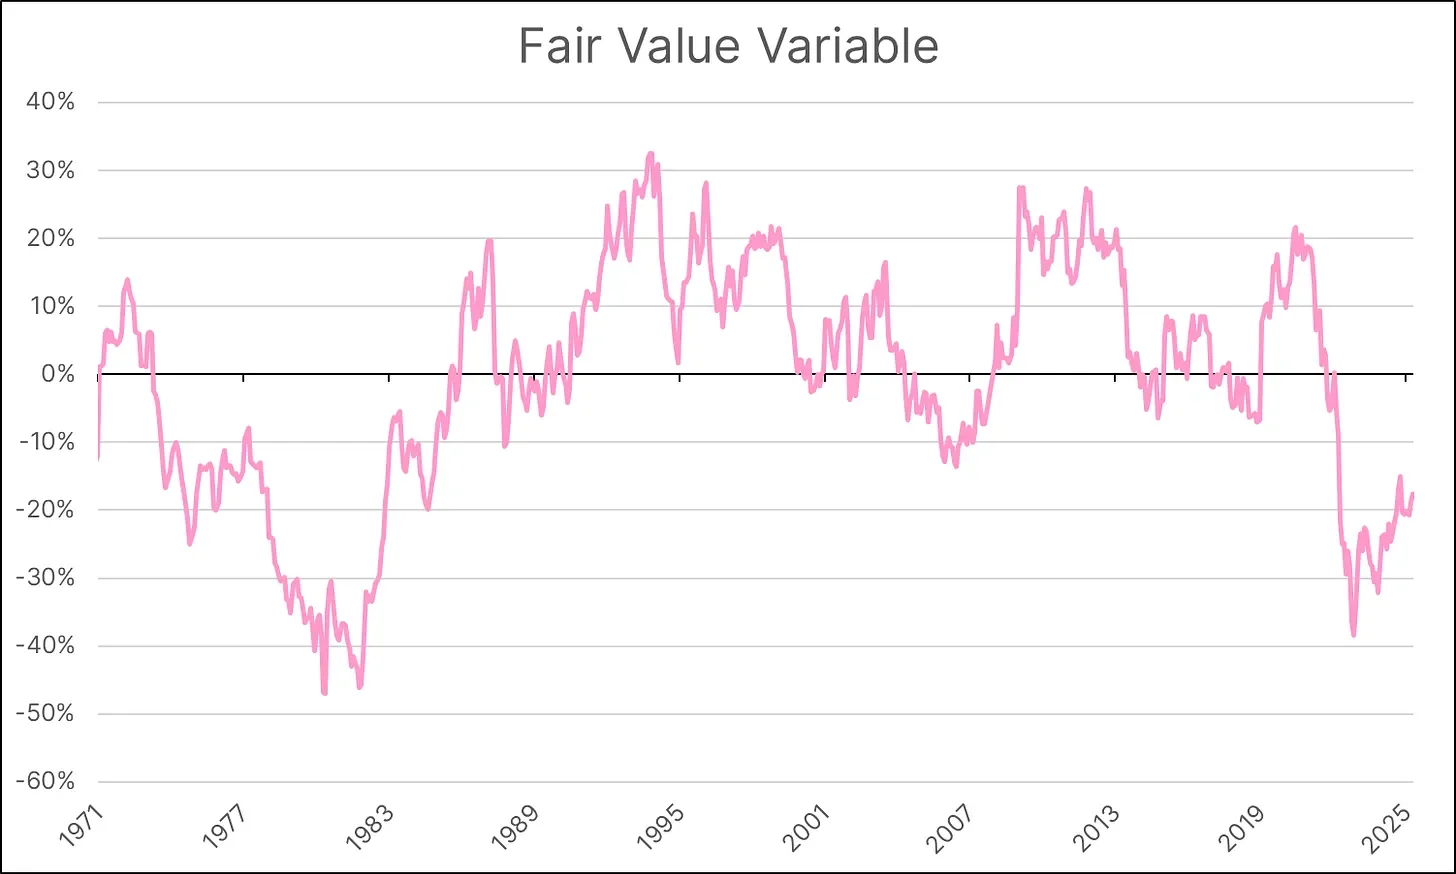
These findings align with our Fair Value Variable, which aims to estimate the appropriate premium or discount in housing prices at any given time. While regional differences exist—and this metric cannot determine the exact premium or discount for a specific property—it offers a useful gauge of broader affordability trends. To find a period when housing was this unaffordable, we have to look back to the early 1980s.
It’s Not About Inventory Anymore
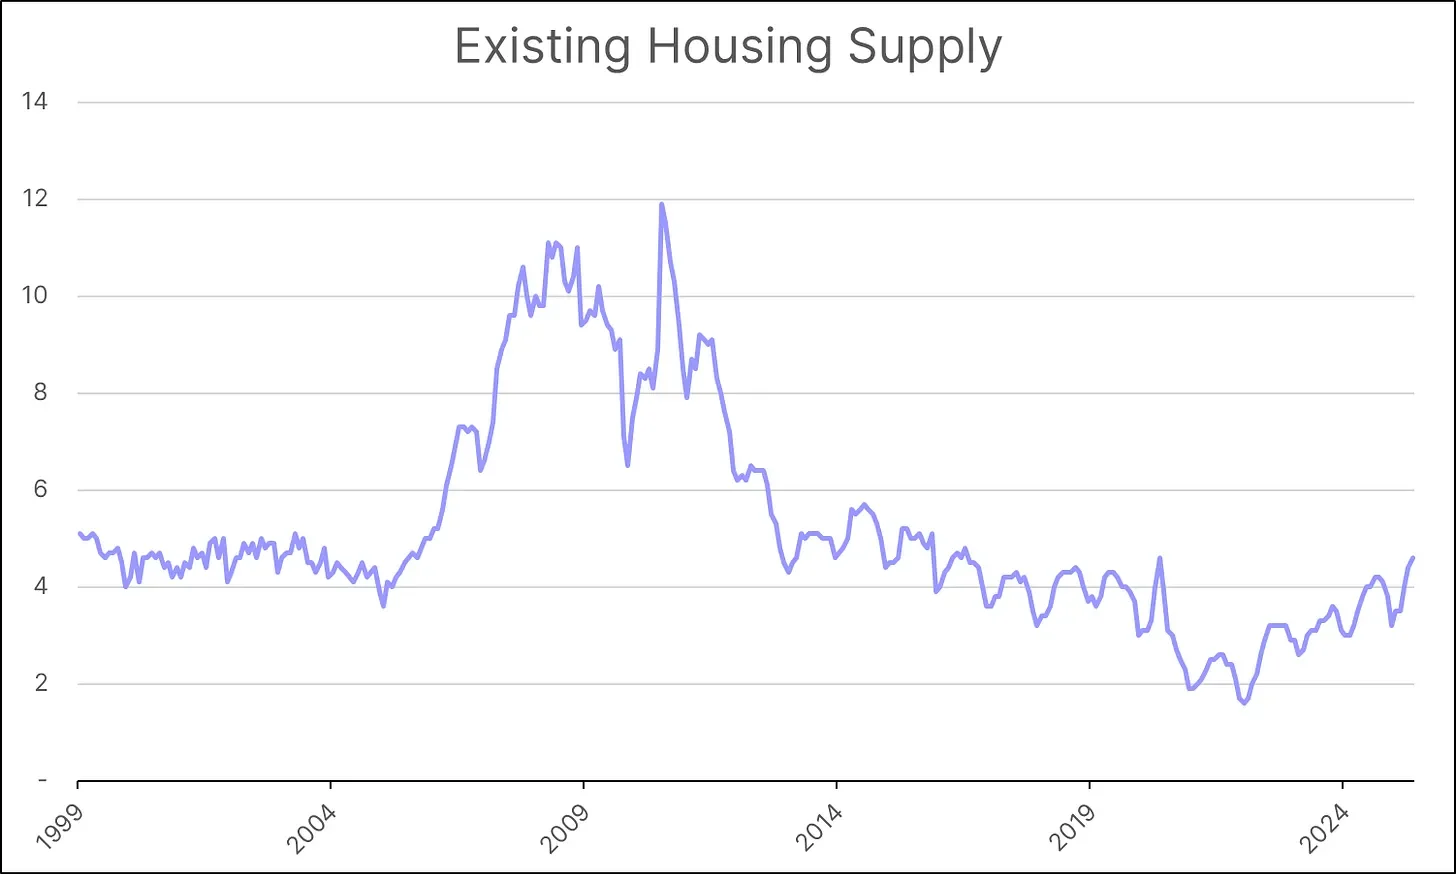
Some attribute the affordability crisis to a lack of inventory, but that explanation is increasingly being set aside as inventory levels return to pre-pandemic norms. The months’ supply of existing homes—which make up the majority of the housing inventory—was measured at 4.6 in May 2025, representing a 21% increase compared to the same time last year.
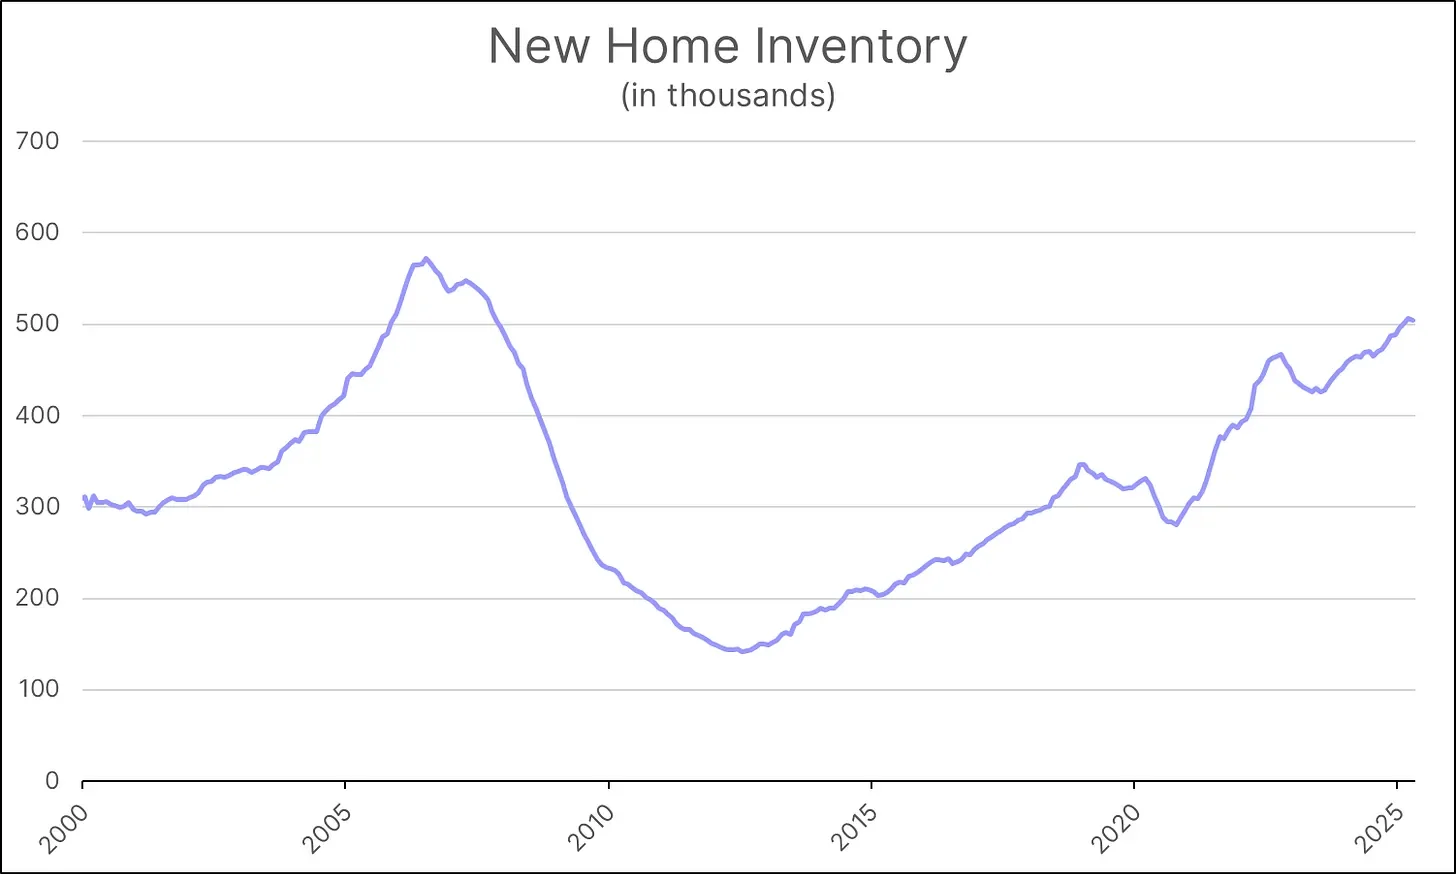
In addition to homeowners looking to sell, homebuilders are also struggling to offload inventory. The supply of new homes has been trending upward since 2012 and has now reached levels rivaled only by the buildup seen prior to the Great Financial Crisis. As of April 2025, homebuilders were sitting on 504,000 new homes.
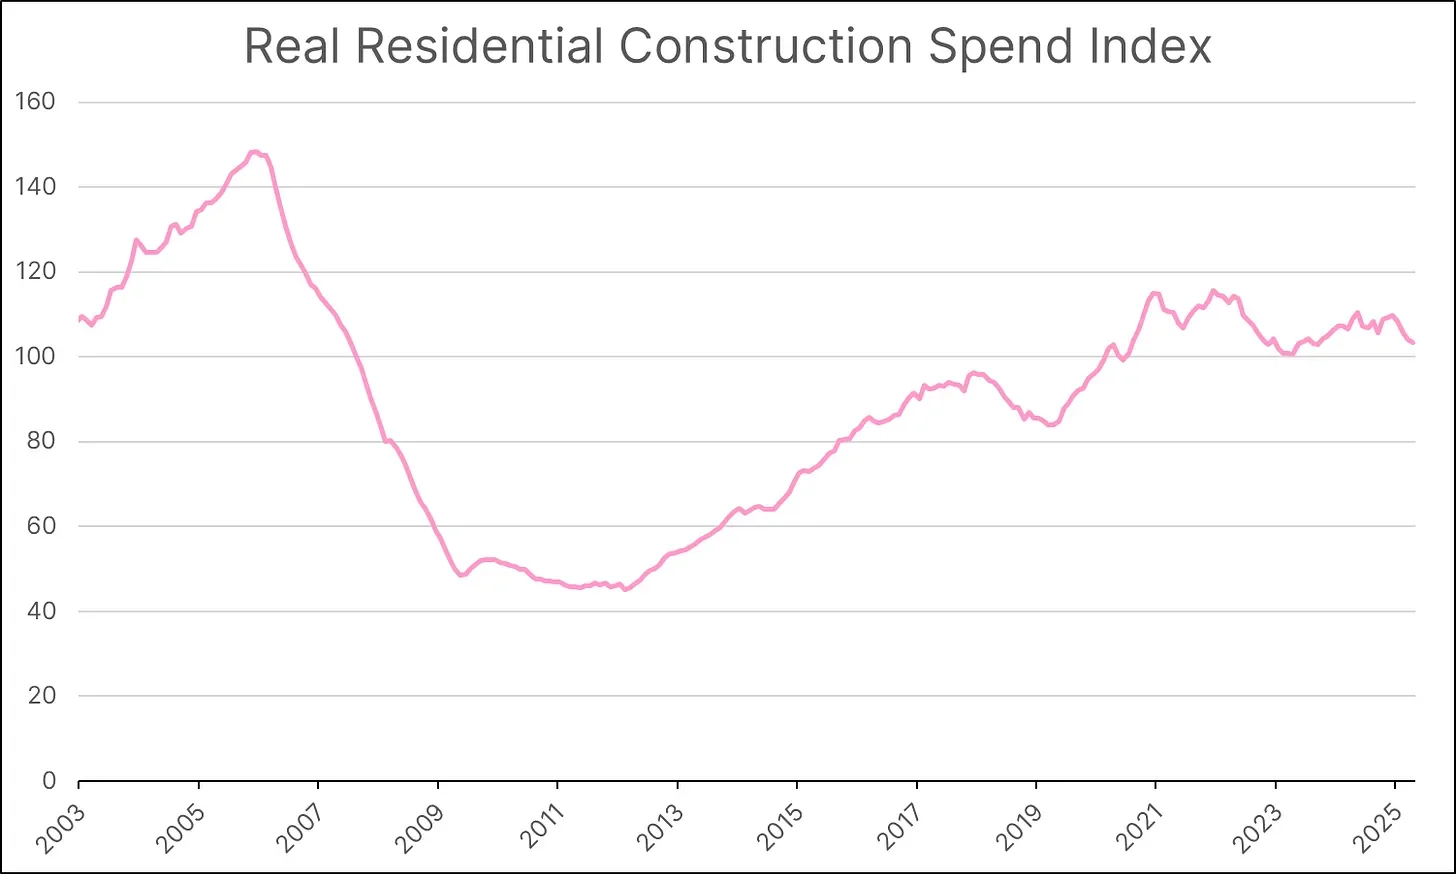
This is despite the fact that real residential construction spending has remained relatively flat over the past five years. The data is calculated by dividing total residential construction spending by the Producer Price Index for Residential Construction.
The Two Components of Unaffordability
As we’ve highlighted in previous papers, the affordability crisis consists of two main components: home valuations and mortgage rates. Some believe that relief will come when mortgage rates decline—and this very well could happen—but it is not our base case assumption. The zero interest rate policy (ZIRP) era was just that—an era—and we’ve seen that the Federal Reserve is struggling to bring down long-term rates, such as the 10-year Treasury yield, which is strongly correlated with mortgage rates.
For more than 40 years, mortgage rates generally trended downward while home valuations trended upward. This was possible because affordability is measured by comparing a household’s income to its monthly mortgage payments. When borrowing costs decline, home prices can rise without reducing affordability.
Today, the cost of borrowing has risen significantly, but home valuations have yet to adjust to this new reality. Again, as noted in previous papers, this isn’t surprising—shifts in home valuations often take years to materialize. Moreover, the presence of a catalyst is crucial.
What to Watch
A decline in home values will likely be preceded by a rise in the unemployment rate, making this an important metric to monitor in the coming months.