
Last year, we published a piece on homebuilder margins, and we figured now would be a good time to revisit the topic.
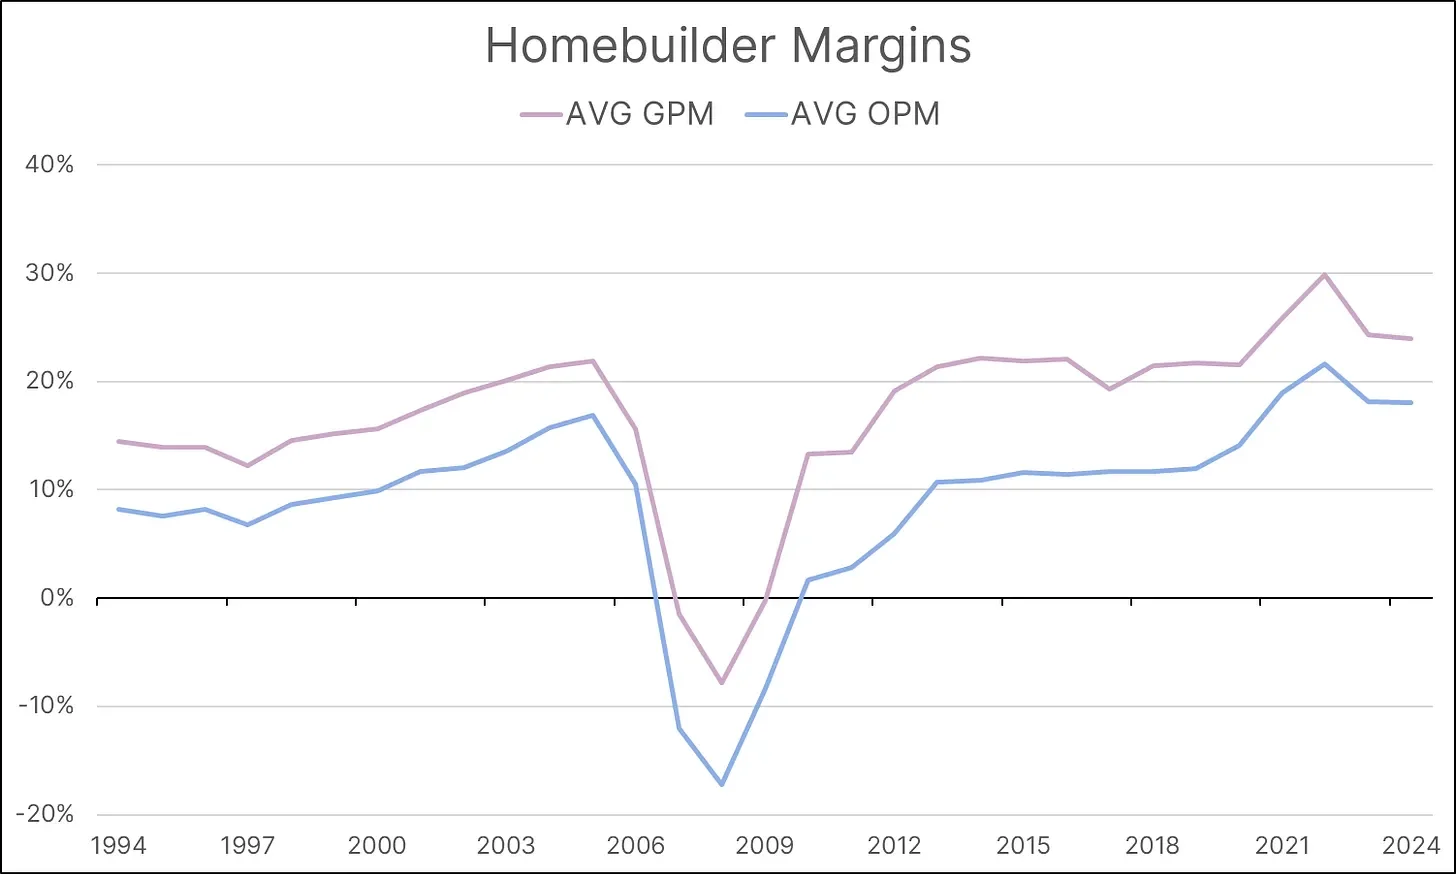
The chart below highlights the average gross profit margin (GPM) and operating profit margin (OPM) for the top four homebuilders—D.R. Horton, Lennar, NVR, and PulteGroup. After peaking in 2022, these margins have declined but remain well above their historical averages.
Zooming In: D.R. Horton
Zooming in on a specific homebuilder—D.R. Horton—we can observe the decline in margins through Q1 2025. As of the latest quarter, D.R. Horton reported a gross profit margin (GPM) of 24.6% and an operating profit margin (OPM) of 12.9%.
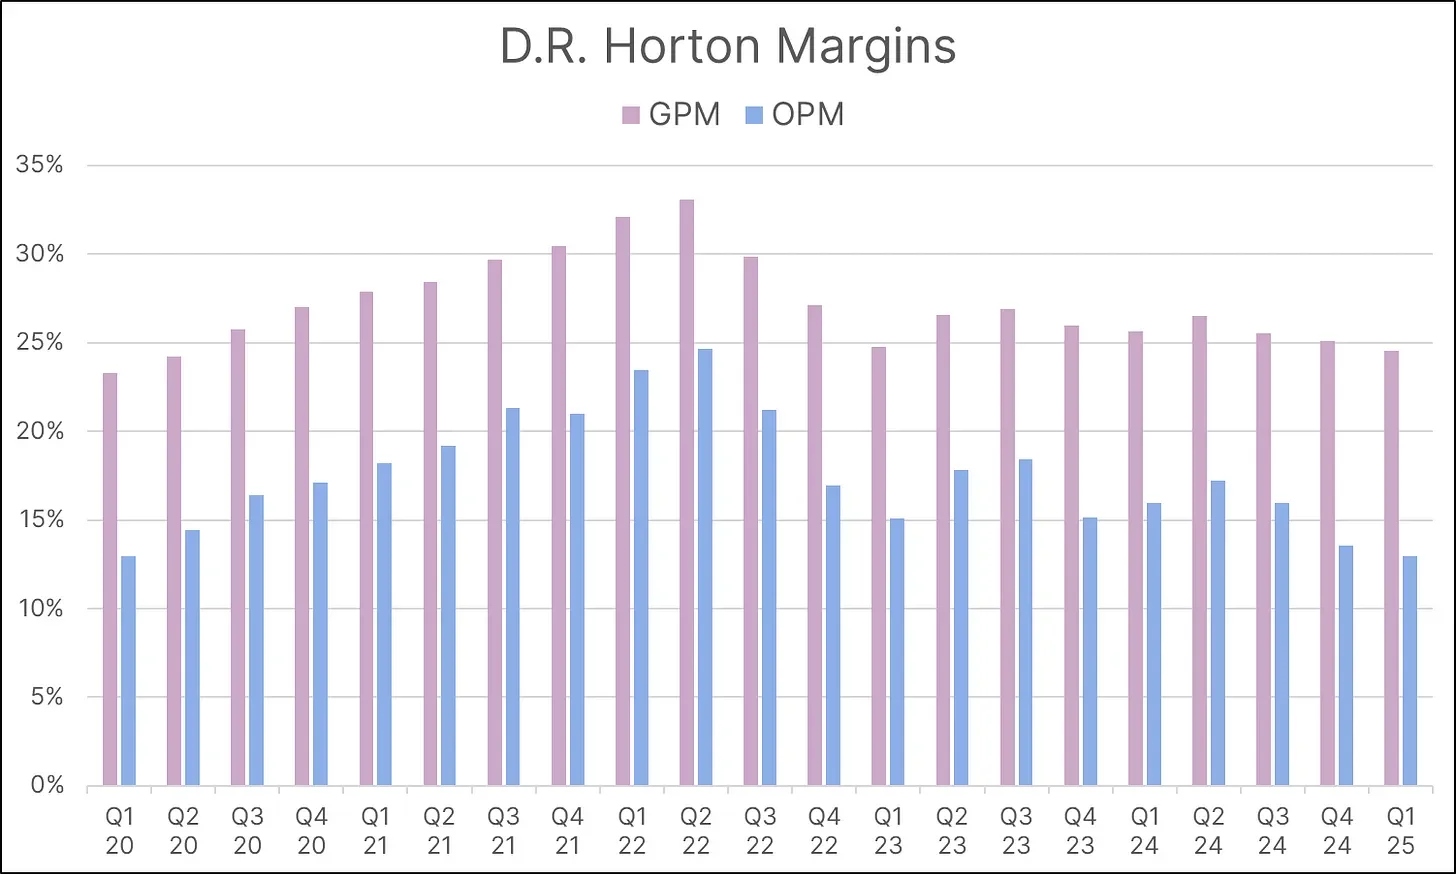
In comparison, the company’s five-year pre-pandemic averages were significantly lower, with a GPM of 21.9% and an OPM of 11.2%.
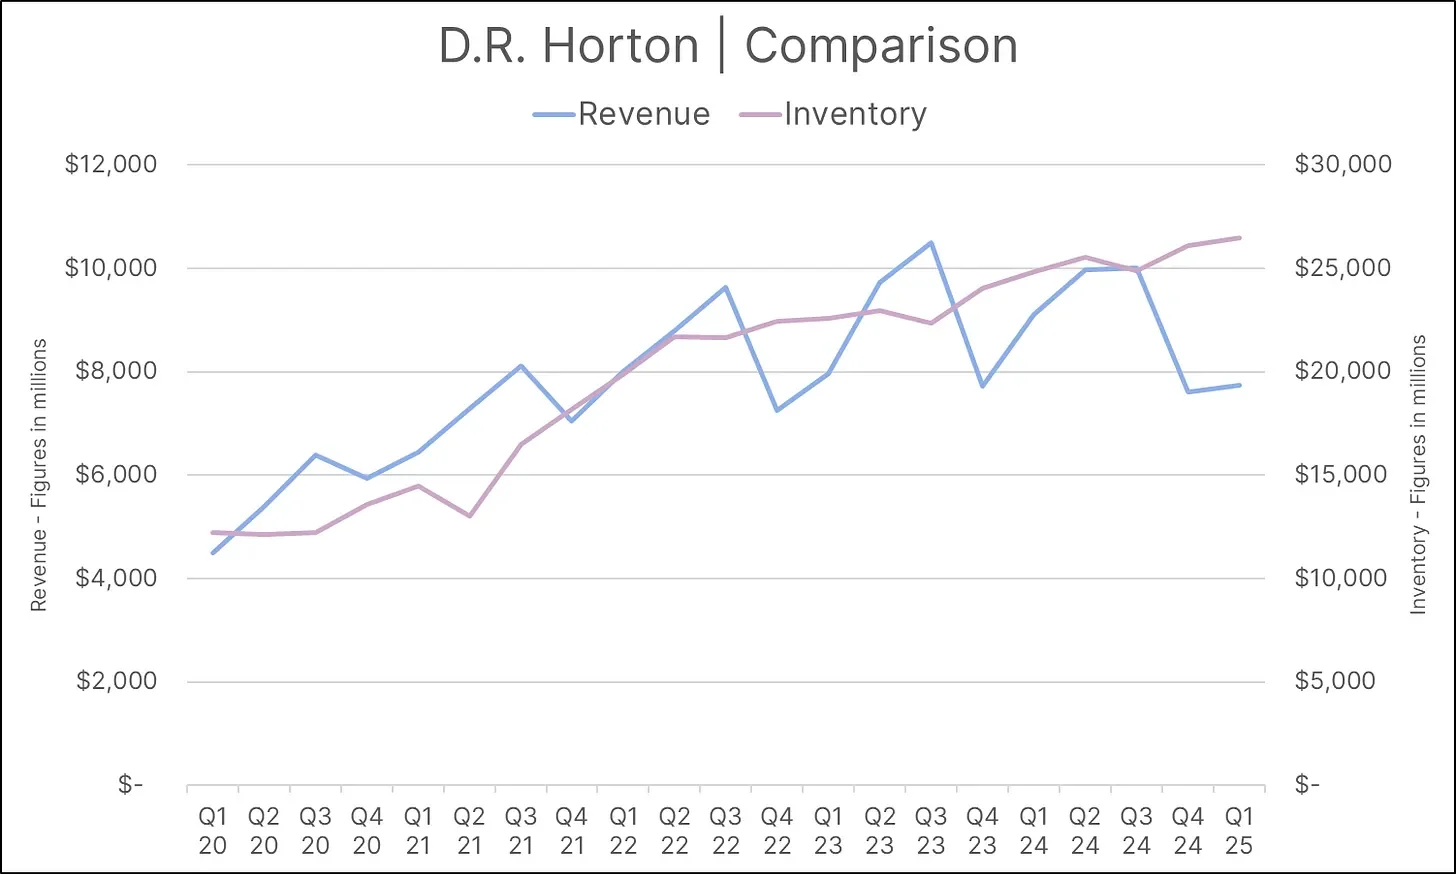
In addition to margins stagnating below their peak levels, revenue has begun to plateau—while inventory continues to rise.
The Inventory Problem
However, this trend is not unique to D.R. Horton. New home inventory continues to rise and has reached levels not seen since the Great Financial Crisis. In fact, that was the only other time inventory was this high.
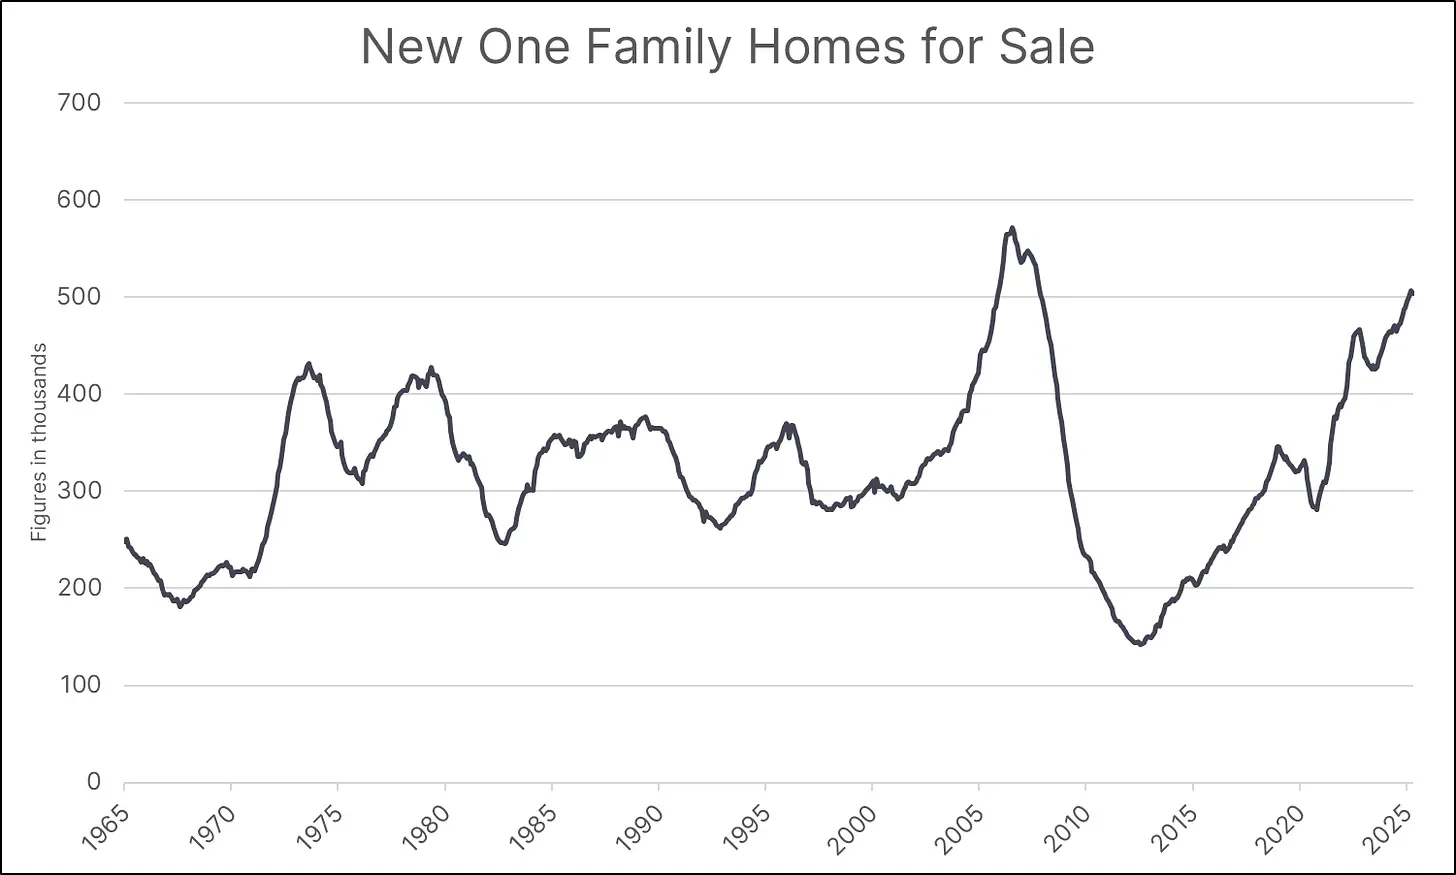
However, it’s important to consider the population growth that has occurred over the past century.
Part of the reason revenue has been declining is due to concessions, which can include covering portions of the buyer’s closing costs or other expenses such as appraisal fees, title search fees, inspection fees, and more. Additionally, mortgage rate buydowns—a financing arrangement where the interest rate on a mortgage is temporarily or permanently reduced in exchange for an upfront payment—have been increasingly offered by homebuilders to entice buyers.
According to the National Association of Realtors, home sellers gave concessions to buyers in 44.4% of U.S. home-sale transactions during the first quarter of this year. That’s up 39.3% from last year and just shy of the record high set in 2023, which was 45.1%.
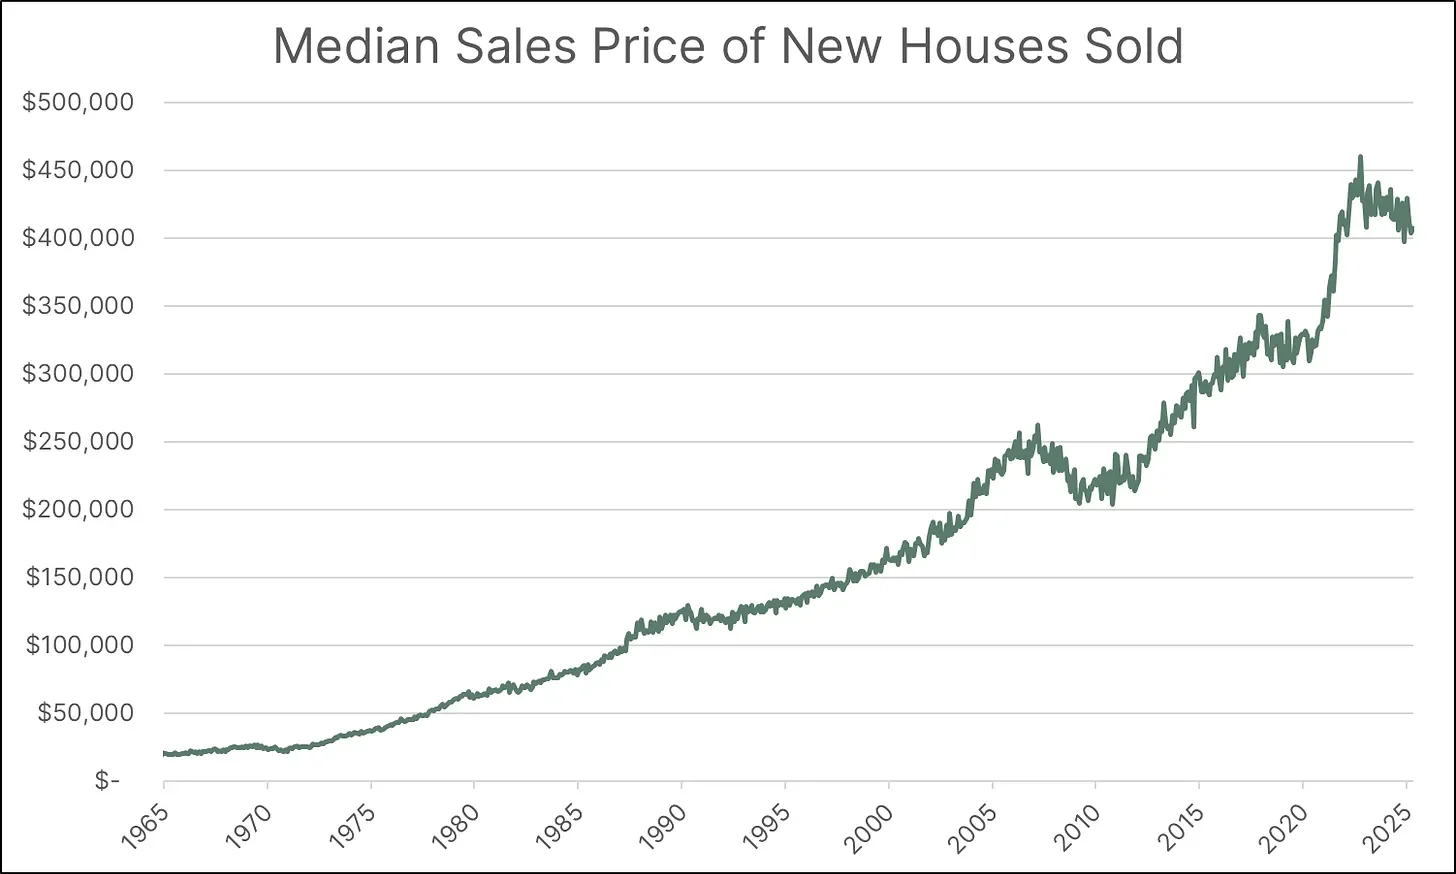
Homebuilders like D.R. Horton report home sales revenue net of concessions, including the cost of mortgage rate buydowns. Combined with the growing reliance on concessions to attract buyers, the median sales price of new homes has been declining since its peak in the fall of 2022.
Why Concessions Instead of Price Cuts?
Before moving on, you may have been wondering: “Why do homebuilders offer concessions rather than simply lowering the price of the home?”
That’s a great question. There are several reasons why a homebuilder might choose to use concessions instead of price reductions, but the primary reason is to maintain a high sticker price. Real estate is a unique asset class in that valuations are less precise and more sticky. Other asset classes—like equities, precious metals, and bonds—can experience rapid valuation changes and trade hands at much higher speeds compared to real estate.
Additionally, valuations derived from real estate appraisers aren’t as technical or immediate as one might assume. Appraisals tend to lag behind real-time market shifts, especially during periods of decline.
There’s also an emotional component to consider. People often feel sentimental about their homes. I don’t know about you, but I’ve never personally felt sentimental about a stock I own.
In today’s market, existing home sellers are facing limited demand. If they become motivated enough to sell, they may lower prices—putting downward pressure on valuations, which could also impact new home prices.
Current Challenges Recap
In summary, let’s recap some of the challenges homebuilders are currently facing:
- Margins have been declining since peaking in 2022
- Inventory continues to rise, reaching levels not seen since the Great Financial Crisis
- The median sales price of new homes has been trending lower since 2022
- Existing home sellers may reduce prices to spark demand
The Mortgage Rate Problem
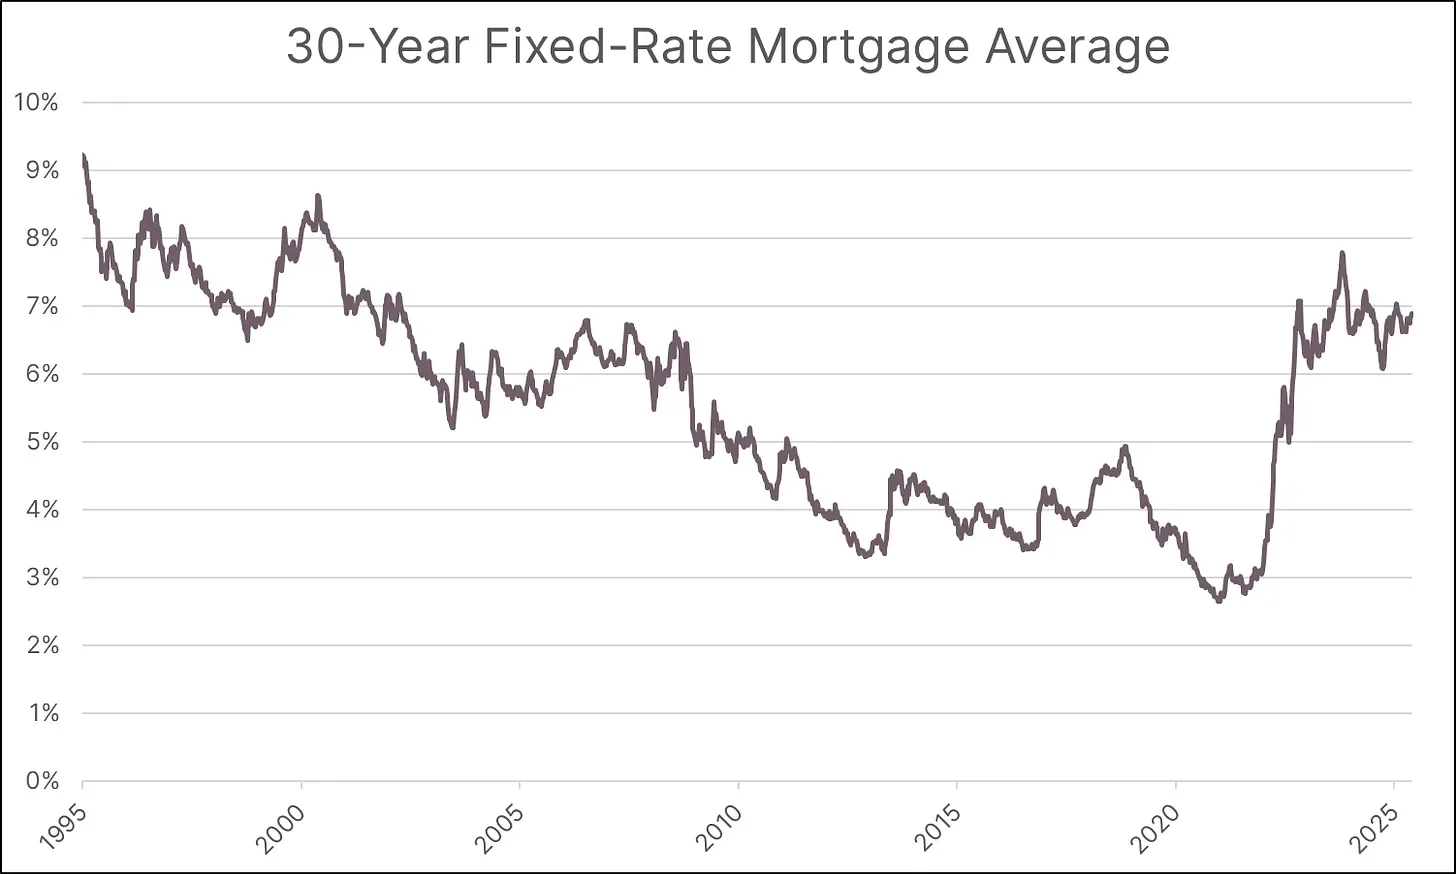
One of the primary obstacles to affordability is, of course, valuation levels, but the other major factor is mortgage rates. When the Federal Reserve began raising the federal funds rate in 2022, mortgage rates climbed in tandem.
The relationship between the 10-year Treasury yield and the 30-year fixed-rate mortgage is well established, and the spread between the two fluctuates due to a variety of factors. As of the end of May, the most recent spread stood at 243 basis points.
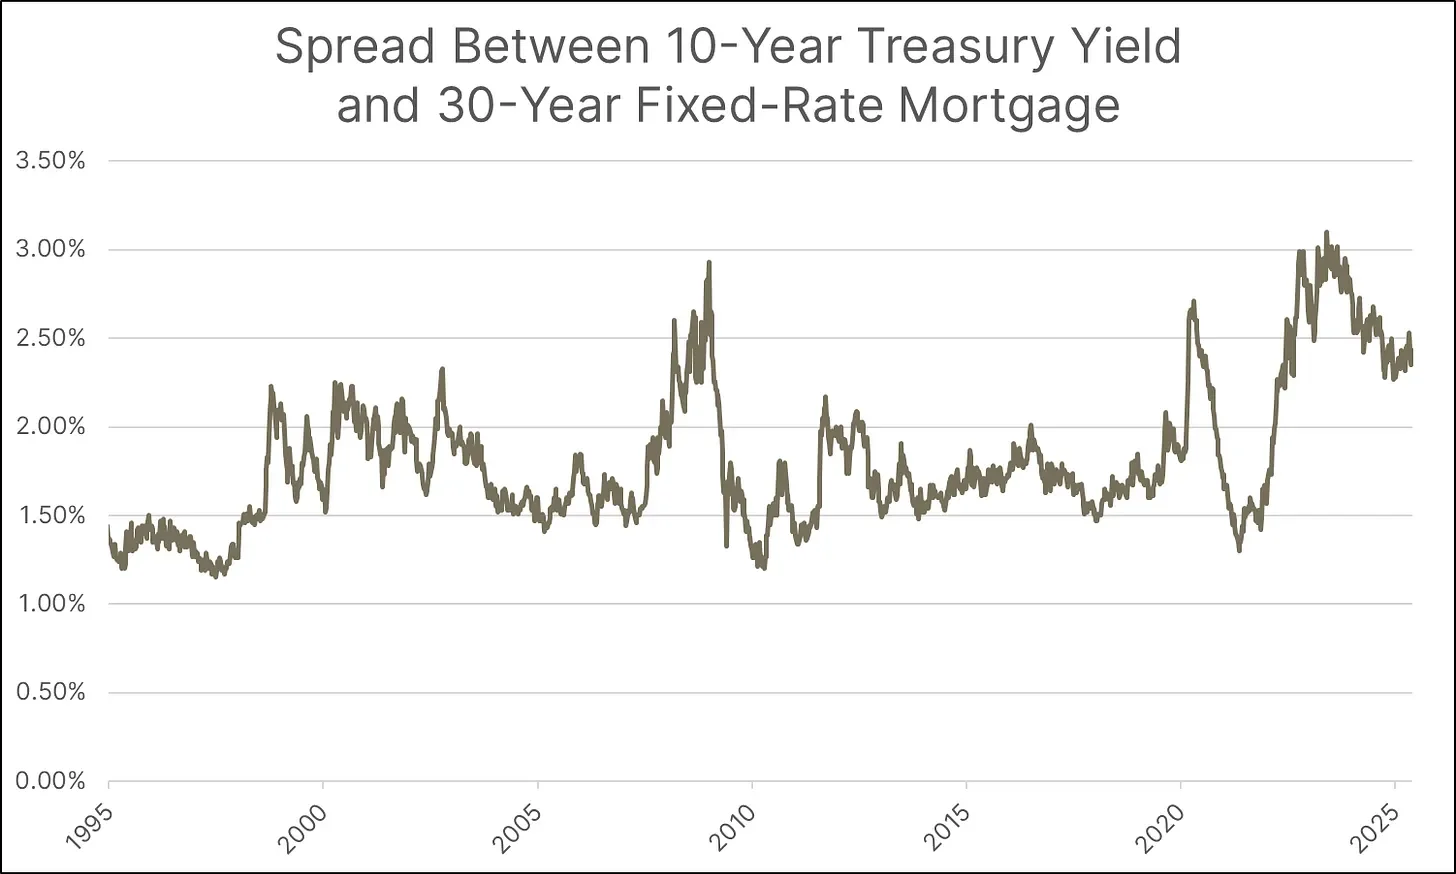
It’s worth noting that the spread typically widens during recessions and narrows during periods of economic stability. In more stable environments, the spread usually ranges between 150 and 200 basis points. Therefore, if economic conditions improve, the spread could compress—resulting in lower mortgage rates. However, given the current economic uncertainty and the headwinds facing the housing market, the spread remains elevated.
Given the impact mortgage rates have on housing affordability, homebuilders will want to see these rates come down. If a reduction in the spread does not occur, the only other path to lower rates is a decline in the 10-year Treasury yield.
The 10-year Treasury yield has remained resilient, as have other 10-year government bond yields around the world, including those of Japan, the United Kingdom, France, and Germany.
Federal Reserve members have also been vocal about taking a wait-and-see approach to assess the impact of tariffs on inflation. This stance will likely delay rate cuts, and market participants have increasingly priced out the likelihood of any cuts occurring before year-end. Some now believe rate cuts may not arrive until early next year.
The Unemployment Risk
Returning to existing home sellers, one key concern for homebuilders is avoiding a meaningful rise in unemployment. Existing homeowners don’t necessarily need to lower their prices to spur demand—because many of them don’t need to sell. There’s a crucial difference between wanting to sell and needing to sell, and that difference is often triggered when a homeowner loses their job.
Rising unemployment could push some would-be sellers from wanting to sell to needing to sell, and that’s when price discovery accelerates. If you’re forced to sell, you may be willing to lower the price, leading to a wave of rapid price cuts. This affects not only the value of the home being sold but also the valuations of surrounding properties.
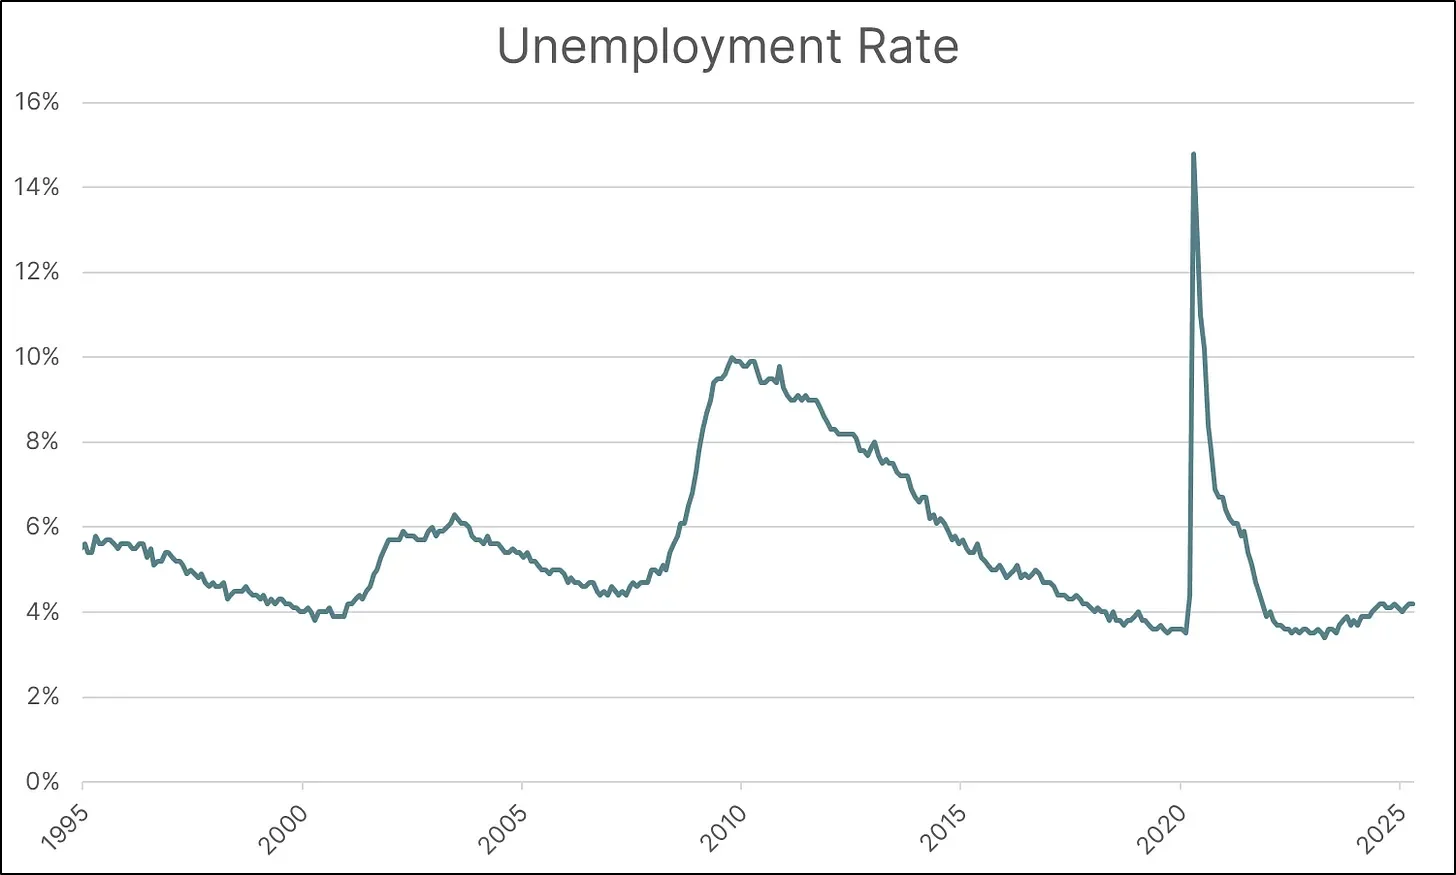
As mentioned earlier, this can also impact the valuations of new homes. After the Dot-Com Bubble, unemployment rose to 6.3%; during the Great Financial Crisis, it peaked at 10.0%; and at the height of the pandemic, it reached 14.8%. If unemployment—measured at 4.2% in April 2025—were to rise above 6%, it could severely affect home values, leaving homebuilders sitting on a stockpile of inventory that has declined in value.
The Complete Picture
Let’s do another recap of this new information:
- The spread between the 10-year Treasury yield and the 30-year fixed-rate mortgage remains roughly 50 basis points above its typical level during periods of economic stability.
- The 10-year Treasury yield remains resilient, which has kept mortgage rates elevated.
- Federal Reserve members have been vocal about their apprehension toward reducing rates.
- Unemployment has been trending upward since its trough in April 2023.
In short, homebuilders are facing a multitude of headwinds.
Wall Street’s View
Before concluding this paper, let’s examine how Wall Street is treating homebuilder stocks.
The price-to-earnings (P/E) ratio is a widely used financial metric that compares a company’s stock price to its earnings per share (EPS). This metric tells investors how much they are paying for each dollar of earnings the company generates. The higher the number, the more an investor is paying for a dollar of earnings.
At the beginning of this paper, we showcased average margins for the four largest homebuilders. Let’s now take a look at these companies’ current P/E ratios:
- D.R. Horton: 9.35
- Lennar: 8.03
- NVR: 14.84
- PulteGroup: 7.19
Now that we know the current figures, let’s examine where these ratios stood six years ago, placing us in the summer of 2019:
- D.R. Horton: 9.69
- Lennar: 7.43
- NVR: 16.27
- PulteGroup: 9.04
Unsurprisingly, most homebuilders have seen a decline in their P/E ratios. However, Lennar’s P/E ratio has actually increased. Additionally, the decline in P/E ratios is not uniform among the three companies that experienced a drop:
- D.R. Horton: -4%
- Lennar: 8%
- NVR: -9%
- PulteGroup: -20%
This seems like a good place to conclude the paper. Clearly, there is more to unpack to understand why the market is valuing these companies differently, but we’ll save that for a future paper.