
One year ago, the yield on the 10-year Japanese Government Bond (JGB) was 1.00%. As of now, it has climbed to 1.52%.
At first glance, this may seem like a minor move—but if it does, you’re missing why it matters.
By the end of this write-up, you’ll understand why this shift is significant.
Nuts & Bolts
Before diving into the issue at hand, let’s make sure we understand the basics of how governments are financed. If you’re already familiar with government financing, feel free to skip this section.
Like most countries, Japan spends money on a wide range of things—from defense to healthcare. These are what we’ll refer to as expenses. To pay for these expenses, the government collects revenue, primarily through taxes—both from individuals and corporations.
When a government’s expenses exceed its revenue, it must find a way to cover the shortfall. In modern economies, this typically involves issuing debt. In the United States, this debt is called Treasuries. In the United Kingdom, it’s known as Gilts.
Ultimately, what it’s called doesn’t matter—it’s all government debt.
In Japan’s case, as in others, the government raises funds by selling bonds. Here’s how a bond works: the government issues a document—a bond—promising to repay the holder after a certain period. In the meantime, it pays interest, known as the yield, to the bondholder.
Let’s walk through a simplified example.
Suppose Japan has $100 in expenses in a given year (we’ll use dollars instead of yen to keep things simple), but only $90 in revenue. That leaves a $10 shortfall. To finance it, the government issues a $10 bond with a maturity of 10 years. After gauging market sentiment, it finds that investors expect a 1.00% annual return. So, Japan offers to pay $0.10 per year in interest.
Investors, satisfied with the yield, buy the bond. The government now has the funds to cover its expenses—and can worry about repaying the bondholder down the road.
Support Beams
Now that we’ve covered the basics of government financing, let’s look at how it can fluctuate over time.
When a government spends more than it collects in revenue—that is, when expenses exceed revenue—the gap is known as a deficit. Conversely, when a government spends less than it brings in, the excess is called a surplus.
Many governments around the world operate with a deficit—in other words, they routinely spend more than they earn.
Let’s take a moment to consider individual debt. When a person wants to borrow money, they typically go to a bank. The bank then evaluates whether the individual qualifies for a loan—usually based on their income, expenses, and any outstanding debt. For most people, income comes from a job, which is a straightforward concept.
However, when the bond market evaluates a government to determine whether it “qualifies” for a loan, the picture is far less clear.
As mentioned earlier, most government revenue comes from taxation, which means it’s directly tied to the health of the economy. If every individual and business disappeared, there would be nothing to tax—no income, no sales, no corporate profits.
Because of this, bond markets evaluate the size of a government’s debt in relation to the size of its economy. The most commonly used metric for this is Gross Domestic Product (GDP), which measures the total monetary value of all goods and services produced within a country over a specific period—typically quarterly or annually.
You may have heard the term debt-to-GDP ratio—this is where it comes from, and as we’ll explore, it carries significant weight in assessing a government’s fiscal health.
It’s also worth noting that deficits and surpluses are often expressed as a percentage of GDP. This allows us to gauge, in relative terms, how much the government needs to finance to cover its expenses. To better understand this concept, let’s examine how it has played out historically in the United States.
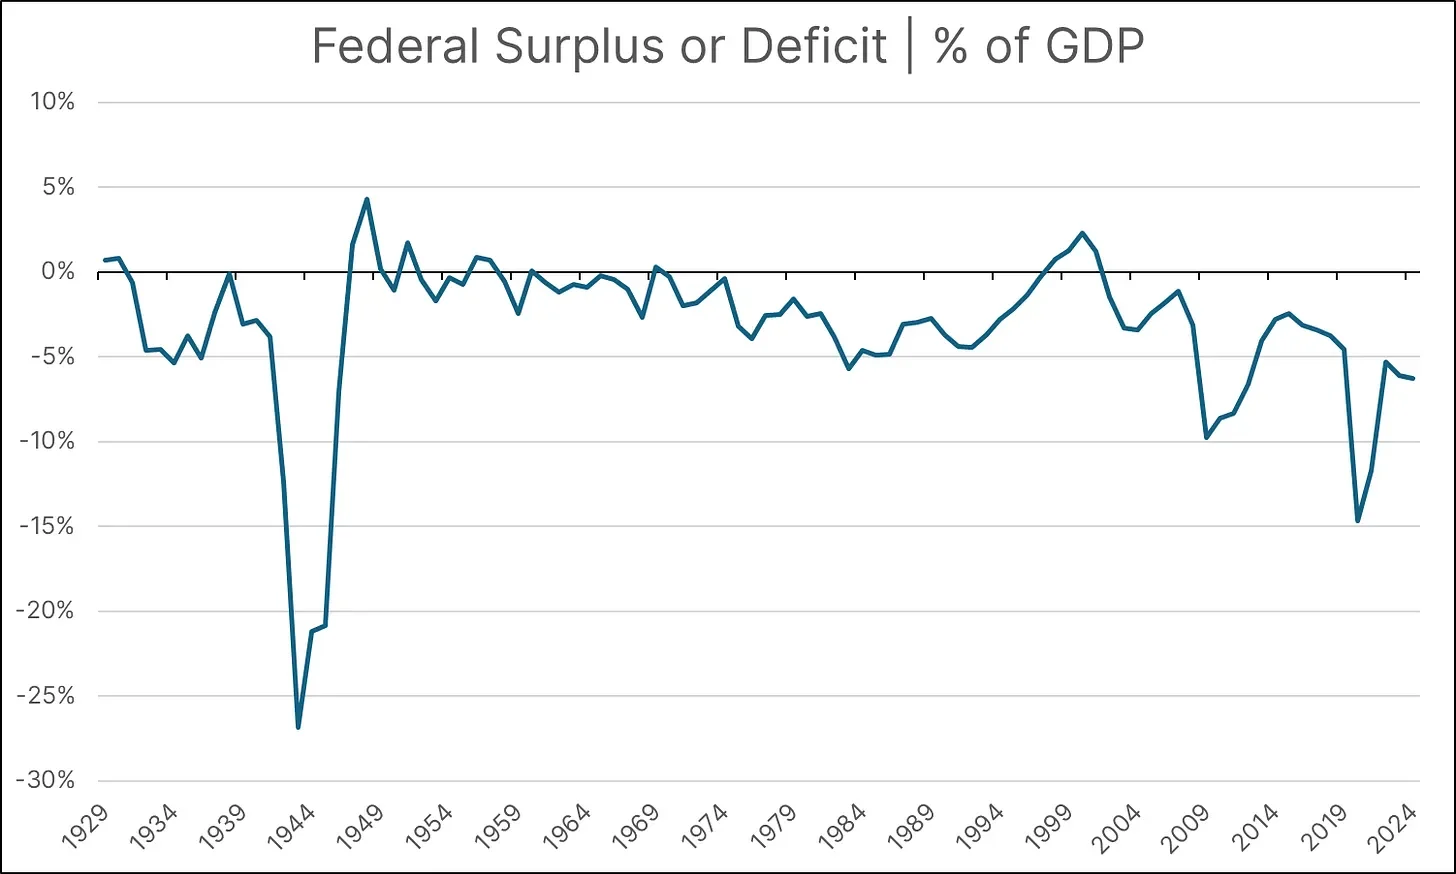
There are three notable spikes in the chart above, each with a clear explanation. The first spike was driven by massive spending during World War II. The second occurred during the Great Financial Crisis, when the government bailed out the banking sector. The third spike reflects the stimulus spending that took place during the COVID-19 pandemic.
In addition to the prominent spikes, there are some general trends visible in the chart. First, the U.S. government has historically operated at a deficit. Moreover, over the past few decades, the level of deficit spending has steadily increased.
As mentioned earlier, it’s important to consider GDP, since it represents the economic base from which the government generates revenue to repay its debt. The next chart shows the same federal surplus or deficit, but adjusted for changes in GDP.
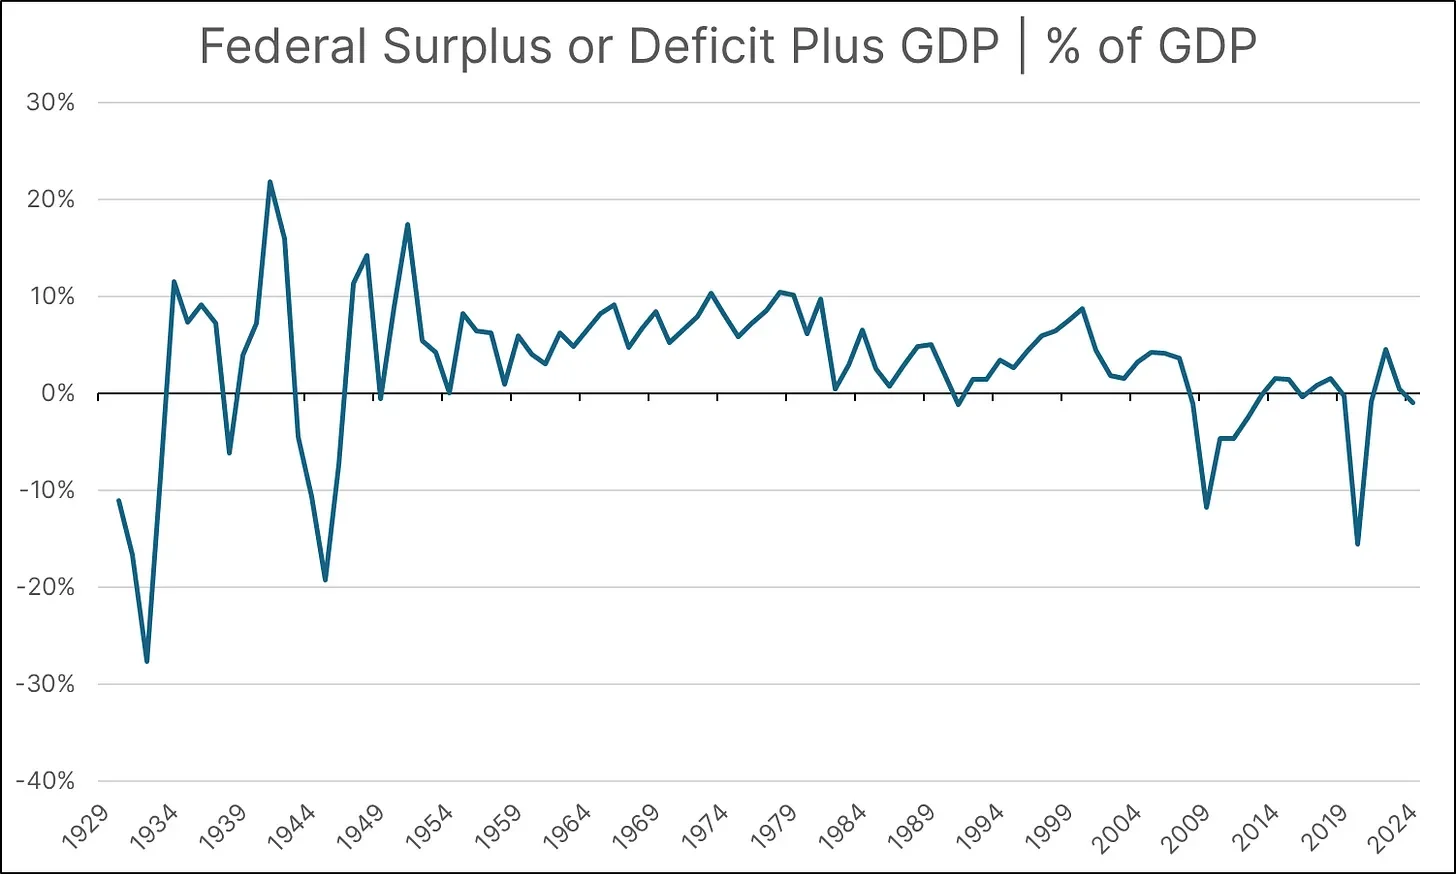
For example, if the deficit was 3% of GDP in a given year, but GDP grew by 4%, the net figure would be a positive 1%. As you can see, when adjusted for changes in GDP, real deficit spending between 1950 and 2000 was nearly nonexistent.
Before moving on to the next element, it’s important to explain why this type of adjustment is worth considering. If a government runs a 5% deficit in a given year, but GDP grows by 5%, this is generally viewed as sustainable. The increase in economic output effectively offsets the higher spending by boosting potential revenue.
Grease The Wheels
If you haven’t seen the film Grease, released in 1978, the final scene features the love interests, Danny and Sandy, driving off into the sky in a flying car. Over four decades later, the country of Greece would see its bond yields soar in a similar fashion—though in this case, it was anything but a whimsical or romantic moment.
In politics, the term “grease” often refers to shady payments or favors that help things move along—basically, a polite way to talk about corruption. When it comes to Greece, it’s a real-life warning about what happens when too much grease clogs the system. Years of under-the-table deals, patronage hires, tax evasion, and bribery kept the government running—until eventually, the whole machine broke down.
Okay, so what does this have to do with Japan or the United States? Let’s examine what happens when the bond market loses confidence in a country’s ability to repay its debt.
Greece is not the first country to experience what is commonly known as a sovereign debt crisis, but it serves as a clear example of what happens when a country’s bond market collapses. Let’s explore how bond yields can rise dramatically in such situations and what impact this has on a nation.
Earlier in this write-up, we discussed the concept of a bond’s yield. Revisiting this concept is important for understanding how yields fluctuate.
If Greece issues a 10-year bond—meaning it will mature in 10 years—with a coupon or interest payment made periodically, here is how it works: Suppose Greece sells a 10-year bond for $100 with a 5% yield. This means the bond pays $5 per year.
After issuance, imagine the bond market begins to doubt Greece’s ability to repay and starts selling these bonds heavily on the open market. This intense selling drives the bond’s price down to $50. While the price has fallen, the annual coupon payment remains $5. Because the price dropped but the payment stayed the same, the bond’s yield has effectively doubled to 10%.
Now that the market yield for Greece’s 10-year bond has risen to 10%, Greece would need to raise the coupon on any newly issued bonds to match current market expectations.
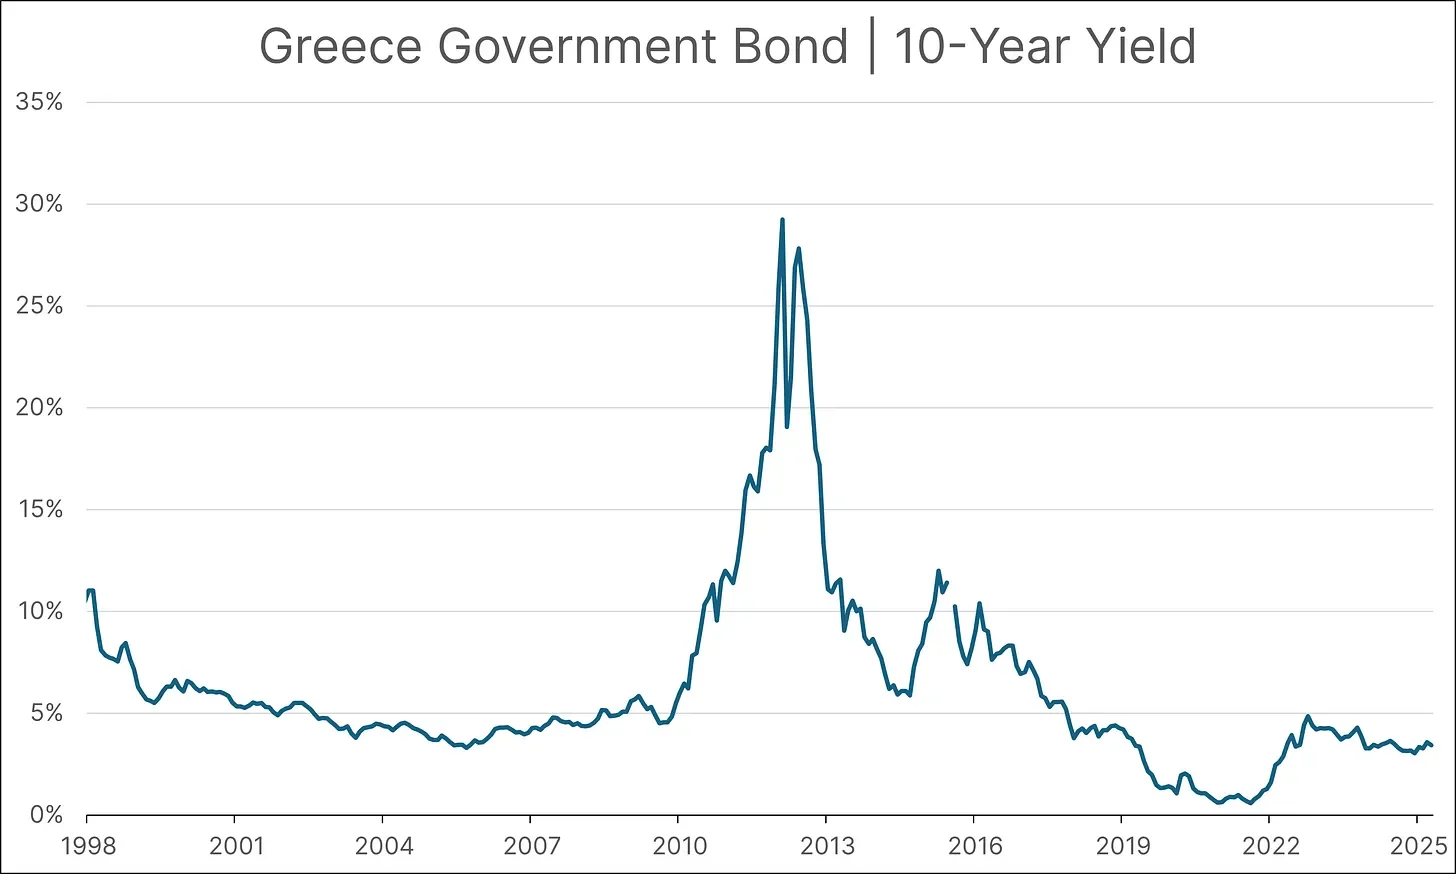
Unfortunately, the earlier example of yields rising from 5% to 10% actually understates the severity of the real crisis—at one point, yields surged from 5% to nearly 30%. This kind of spike quickly becomes unsustainable.
Although Greece’s actual debt-to-GDP ratio was even higher during the crisis, let’s assume it stood at 100%. If the country had to refinance all of its debt at a 5% interest rate, it would result in interest payments equal to 5% of GDP. That may not sound extreme at first glance, but to put it in perspective, let’s look at how this compares to the historical figures for the United States.
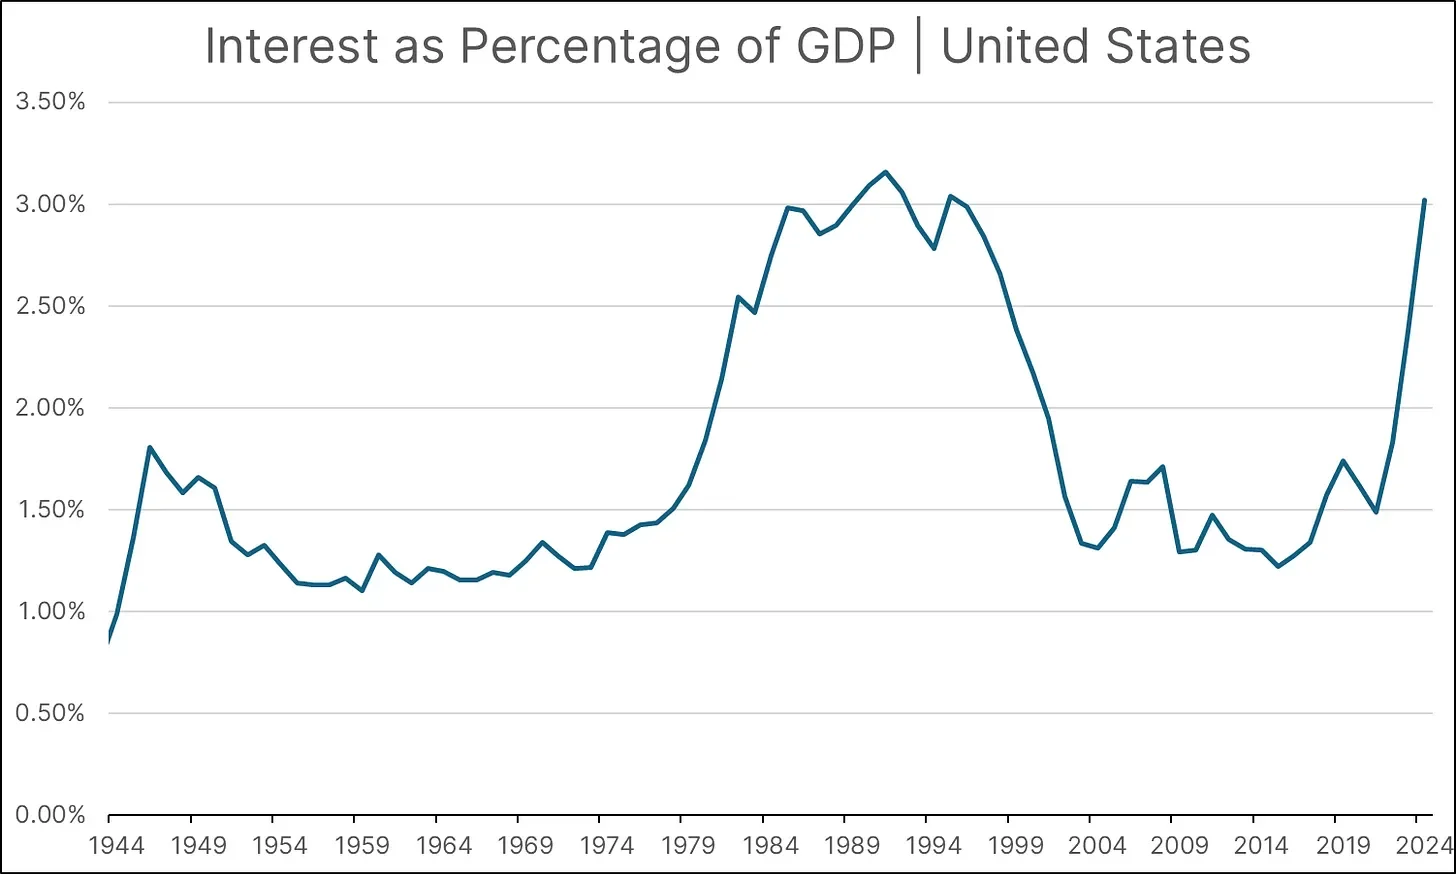
For years, the United States has kept its interest payments around or below 3% of GDP. In our earlier example, we assumed Greece had to refinance its debt at a 5% rate—already a strain. But when the 10-year yield spiked to nearly 30%, the situation became catastrophic.
The key takeaway from Greece’s sovereign debt crisis is that fluctuations in a country’s bond yields can have significant implications for its financial future. One crucial concept to draw from this example is how a country’s debt-to-GDP ratio determines the extent to which changes in yields matter.
Structural Instability
In 2024, according to the Ministry of Finance in Japan, the country had a debt-to-GDP ratio of 237%. This is far and away the highest debt-to-GDP ratio in the world. With this in mind, let’s see what the 10-year JGB has been doing over the past couple of years.
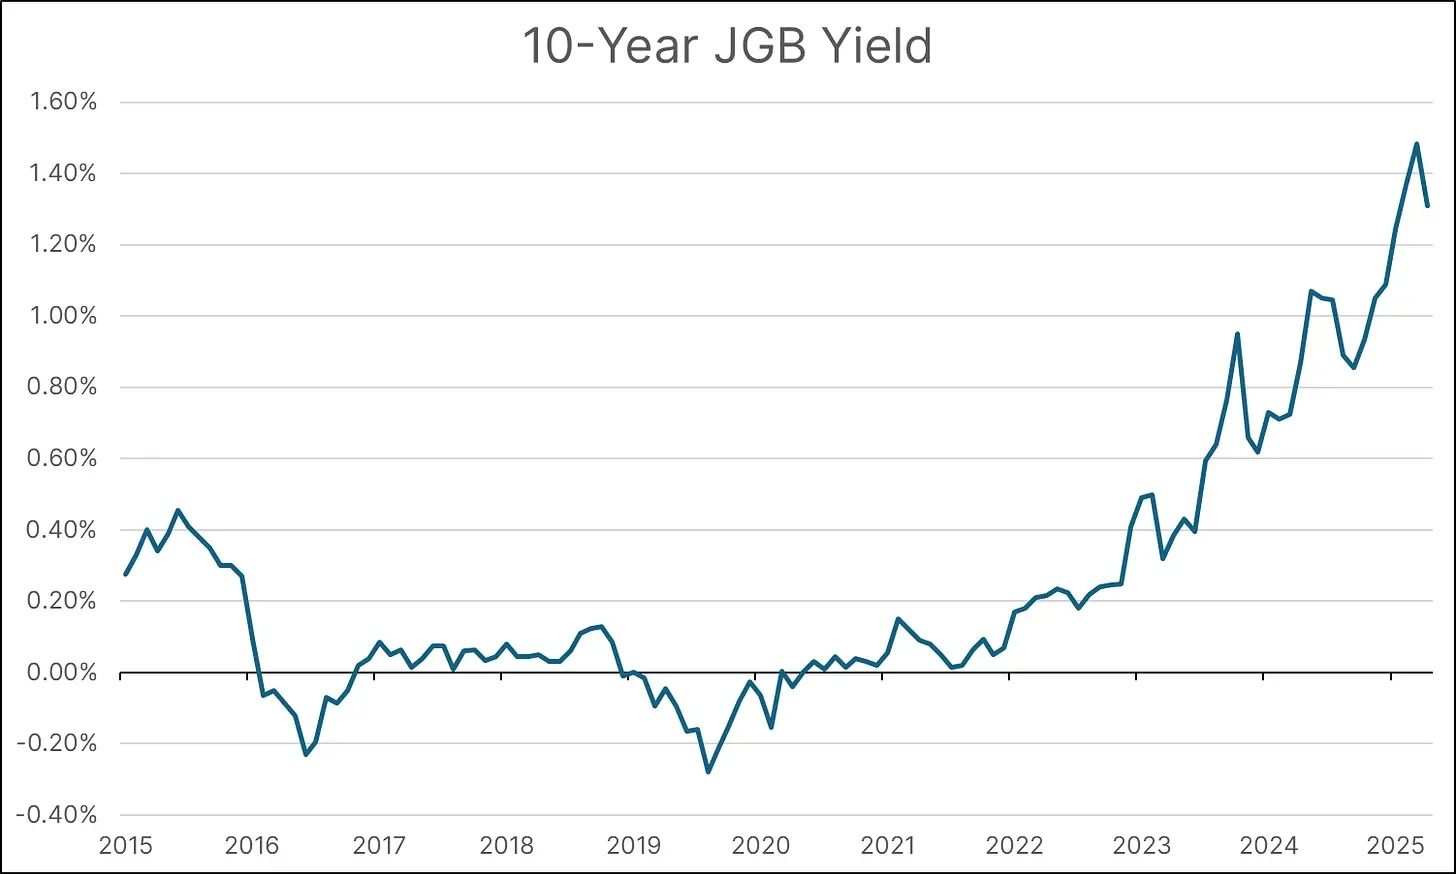
You may have noticed that the 10-Year JGB yield was actually negative for a period of time. While we don’t have time here to dive into how that’s even possible, for the sake of simplicity, just assume the yield was zero.
The key takeaway from the chart above is that yields have been rising over the past couple of years—and given Japan’s debt-to-GDP ratio, this trend carries serious implications.
As we saw in the case of Greece, rising yields can strain a country’s ability to meet its debt obligations. No country in the world has a higher debt-to-GDP ratio than Japan, which makes it especially sensitive to movements in interest rates.
Using data from the IMF, we can examine Japan’s historical interest expenses as a percentage of GDP between 1960 and 2023.
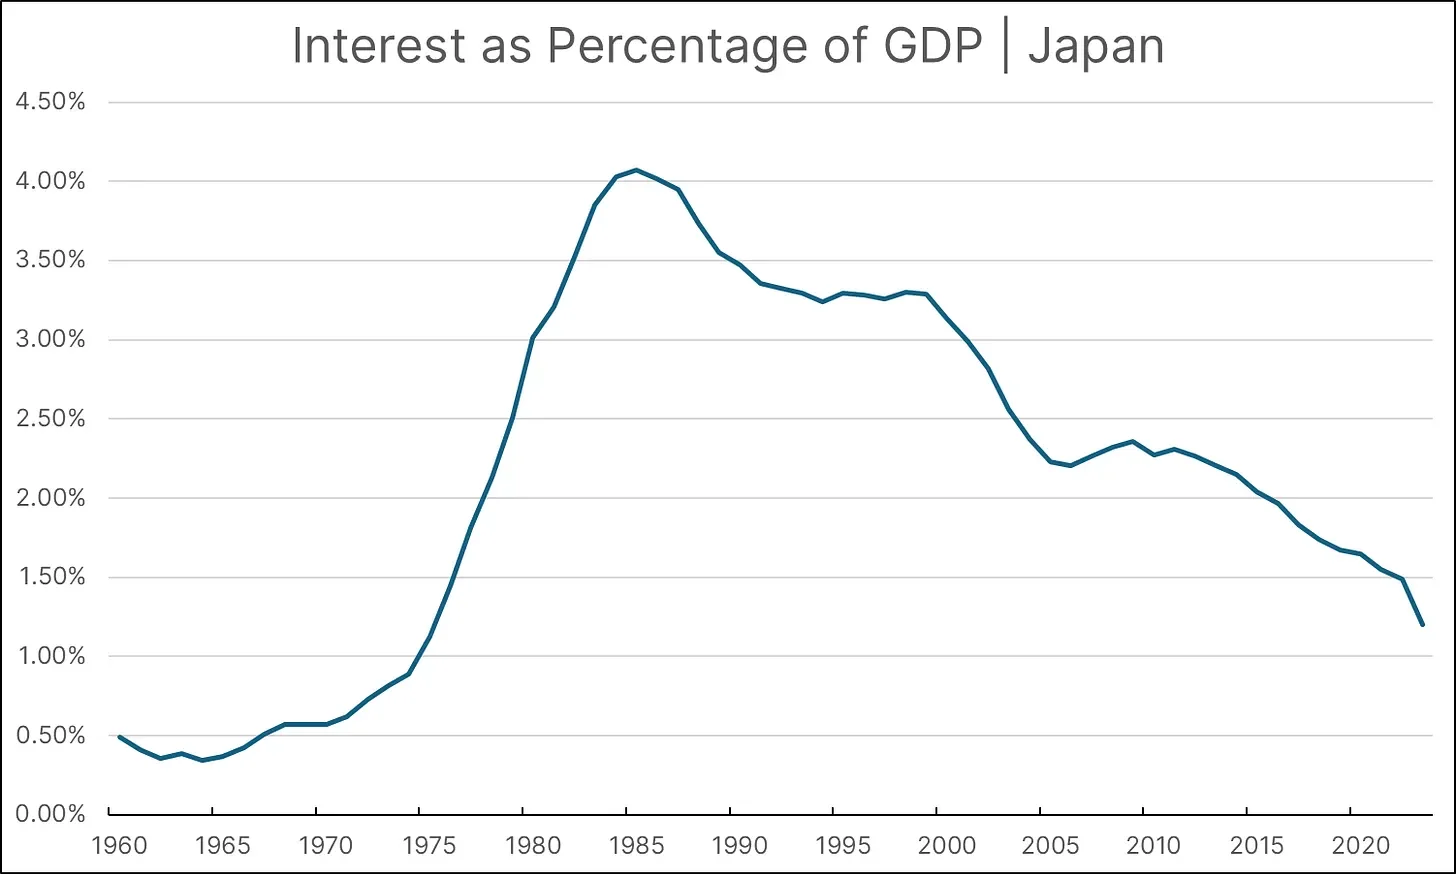
The peak level of interest expense as a percentage of GDP in Japan was around 4% during the 1980s. As Japanese bond yields rise, this level could be reached again—but the country’s economic dynamics have changed significantly since then. In the 1980s, Japan’s debt-to-GDP ratio ranged between 50% and 70%. Today, that figure is closer to 230%.
Why Do You Want To Blow My House Down?
In this final section, we’ll explore why Japanese bond yields are rising and what this means for the United States.
Broadly speaking, there are four primary drivers behind the recent increase in Japanese Government Bond (JGB) yields.
First, the Bank of Japan (BOJ) has shifted away from its longstanding low interest rate policy and large-scale bond-buying program. When a central bank raises interest rates, the goal is typically to reduce inflation. Higher rates make borrowing more expensive for consumers and businesses, which tends to slow economic activity and dampen inflationary pressure.
Second, inflation in Japan is on the rise. This uptick in inflation has prompted the BOJ’s policy shift, aimed at bringing price levels under control.
Third, the rise in yields is not unique to Japan. As shown in the chart below, government bond yields have increased across many countries over the past couple of years.
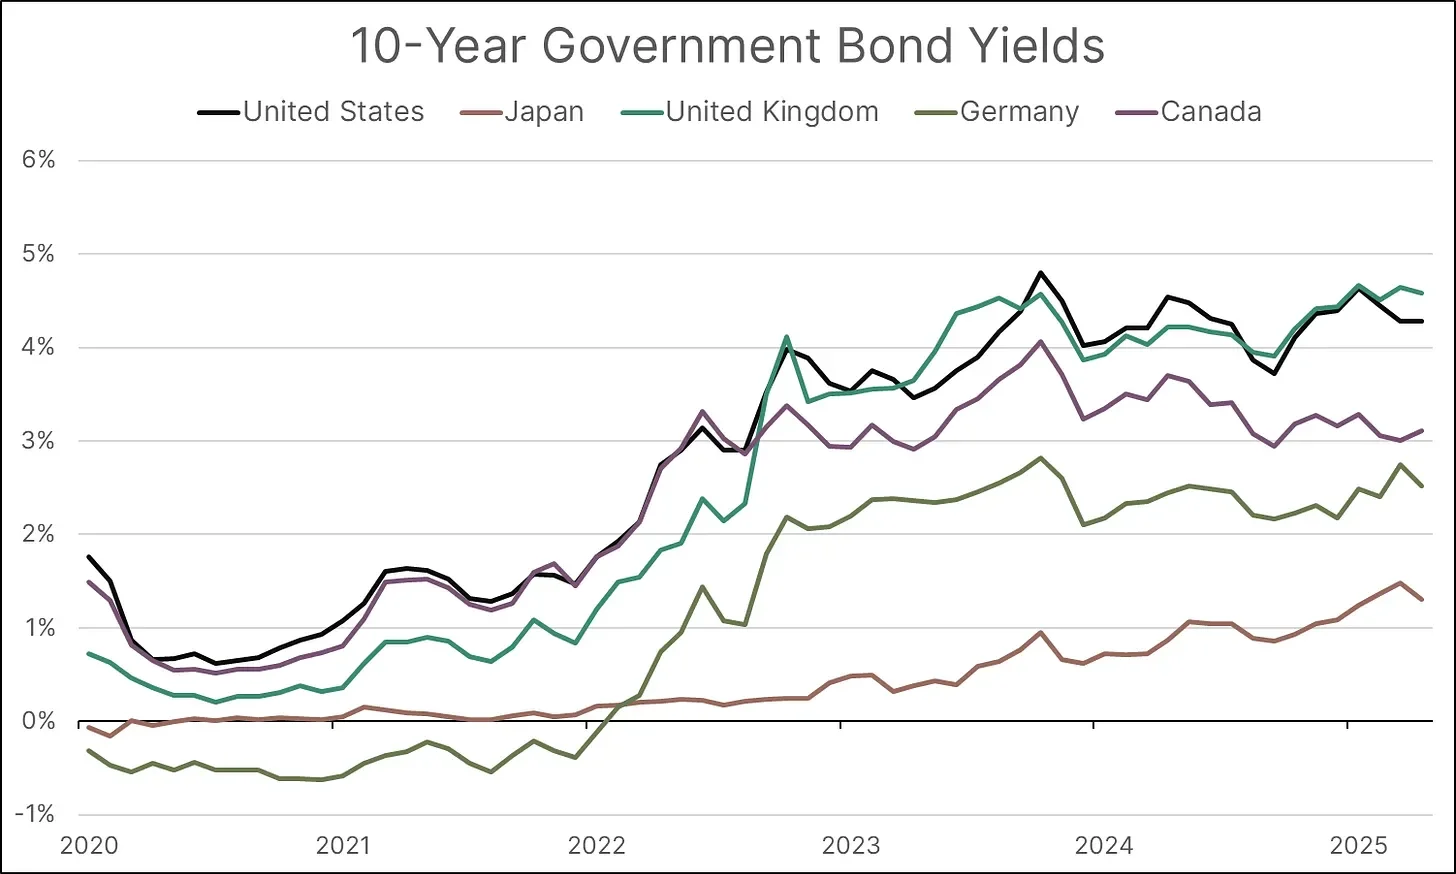
The United States, United Kingdom, Germany, and Canada—among others—have all experienced rising yields. This global trend puts upward pressure on Japanese yields, as relatively lower returns in Japan become less attractive compared to what investors can earn elsewhere.
The final—and most concerning—factor is a potential market repricing of risk. If investors begin to question Japan’s ability to meet its debt obligations, the bond market may reprice government debt accordingly. This can lead to a self-reinforcing spiral of rising yields and declining confidence, similar to what occurred in Greece during the early 2010s.
Now that we’ve addressed why yields are rising and the central bank’s role from a monetary policy perspective, it’s important to examine what the Japanese government is doing on the fiscal side.
The Japanese government has reiterated its long-term commitment to achieving a fiscal surplus—where revenues exceed expenditures. However, officials have signaled that achieving this surplus will be delayed, given the fragile state of the Japanese economy.
This Little Piggy Went To Market
Although the United States has a lower debt-to-GDP ratio and continues to experience population growth—driven in part by immigration—it’s worth examining what the Federal Reserve is doing on the monetary policy front and what the U.S. government is implementing on the fiscal side to ease tensions in the bond market.
Due to the current tariff policy, the Federal Reserve has signaled that it will hold off on lowering interest rates for the time being. The bond market generally favors a central bank that prioritizes price stability, as this helps preserve the purchasing power of the dollar and protects the real return on bond yields over time.
However, from a fiscal policy perspective, there are growing concerns. The recently passed House tax bill, known as the “One Big Beautiful Bill Act,” is projected to significantly increase the U.S. federal deficit over the next decade. Estimates from the Congressional Budget Office (CBO) and the Penn Wharton Budget Model suggest the bill could add between $2.8 trillion and $3.8 trillion to the national debt between 2025 and 2034.
Not only does the bill increase the deficit, but it also injects stimulus into an economy that may already be facing upward inflationary pressure due to tariff policies.
Over the coming months, it will be important to monitor the bond markets, as they will react to how governments respond to recessionary fears and inflationary pressures. If the U.S. government fails to rein in its spending and tax cuts, the bond market may begin to further reprice risk. Without coordinated and reasonable monetary and fiscal policies, questions will arise about the nation’s ability to repay its debt obligations—an outcome that could have profound effects on everyone.